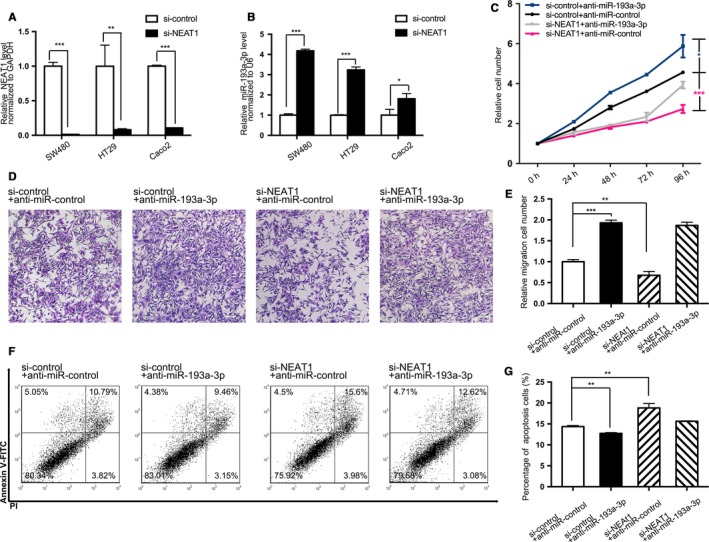
Figure 2.

Effect of NEAT1 siRNA and anti‐miR‐193a‐3p on the CRC cell lines. A,B, Quantitative RT‐PCR analysis of the expression levels of NEAT1 and miR‐193a‐3p in SW480, HT29, and Caco2 cells transfected with equal doses of the si‐NEAT1 and si‐control. A, Expression levels of NEAT1. B, Expression levels of miR‐193a‐3p. C, The cell proliferation assay after four groups of SW480 transfected with equal doses of negative control, NEAT1 siRNA, miR‐193a‐3p inhibitors, and NEAT1 siRNA plus miR‐193a‐3p inhibitors. D, Transwell assay 48 h after aforementioned four groups’ transfection. E, The number of migrated cells was quantified. F, The apoptosis assay 48 h after aforementioned four groups’ transfection. G, The percentage of apoptosis cells was quantified. The results are presented as the mean ± SD of three independent experiments. (*P < 0.05; **P < 0.01; ***P < 0.001).
