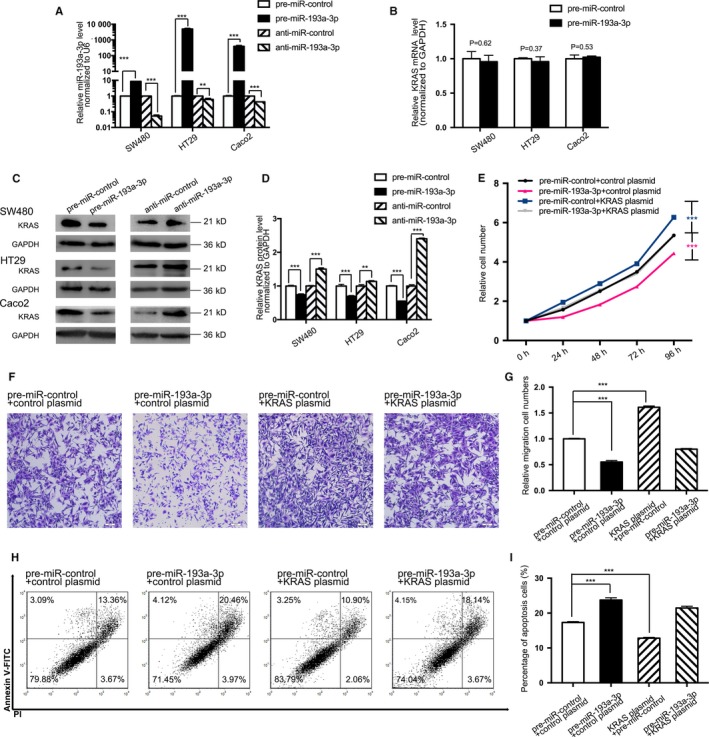
Figure 4.

Effect of miR‐193a‐3p and KRAS plasmid on the CRC cell lines. A, Quantitative RT‐PCR analysis of the expression levels of miR‐193a‐3p in SW480, HT29, and Caco2 cells transfected with equal doses of miR‐193a‐3p mimics, inhibitors, and negative control. B, Quantitative RT‐PCR analysis of the expression levels of KRAS mRNA in SW480, HT29, and Caco2 cells transfected with equal doses of miR‐193a‐3p mimics, inhibitors, and negative control. C,D, Western blotting and the quantitative analysis of KRAS protein levels in SW480, HT29, and Caco2 cells after transfected with equal doses of the miR‐193a‐3p mimics, inhibitors, and negative control. E, The cell proliferation assay after four groups of SW480 transfected with equal doses of negative control, KRAS plasmid, miR‐193a‐3p mimics, and KRAS plasmid plus miR‐193a‐3p mimics. F,G, Transwell assay 48 h after aforementioned four groups’ transfection. H,I, The apoptosis assay 48 h after aforementioned four groups’ transfection. The results are presented as the mean ± SD of three independent experiments. (**P < 0.01; ***P < 0.001).
