Figure 3.

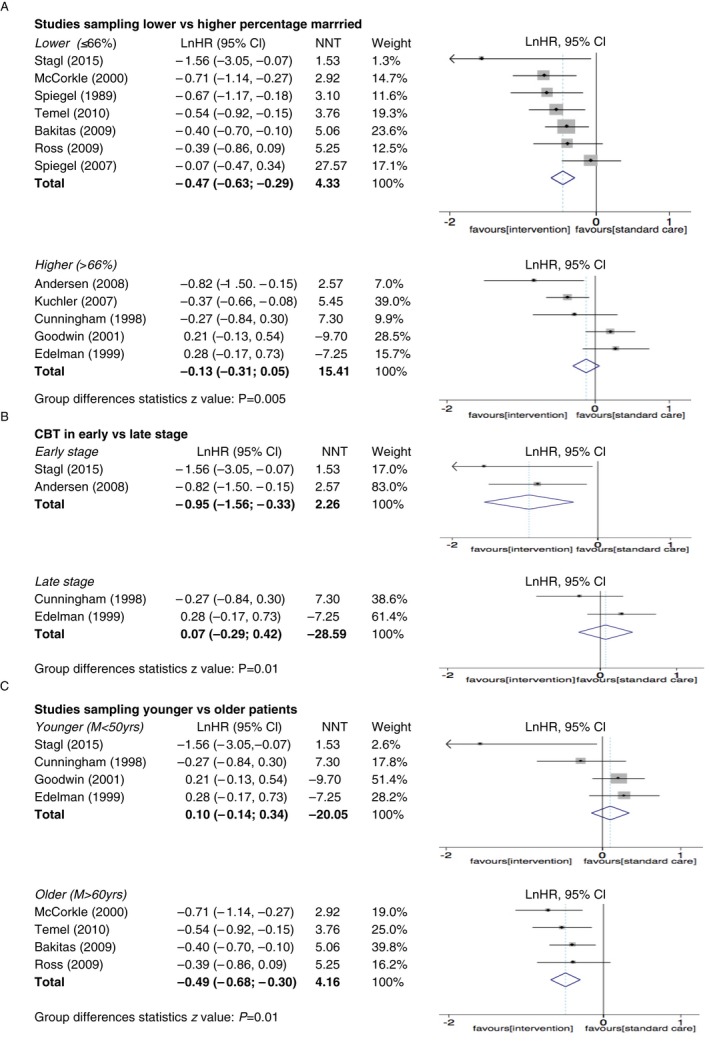
Forest plots of effects sizes for RCT studies of psychosocial interventions on survival. (A) Studies sampling lower vs higher percentage married, (B) CBT in early vs late stage, (C) studies sampling younger vs older patients

Forest plots of effects sizes for RCT studies of psychosocial interventions on survival. (A) Studies sampling lower vs higher percentage married, (B) CBT in early vs late stage, (C) studies sampling younger vs older patients