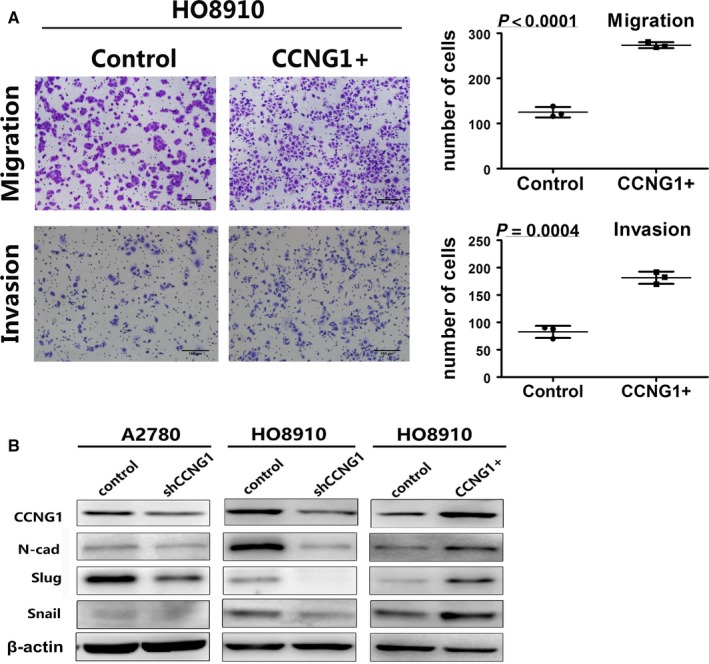
Figure 3.

Interpretation of cell migration and invasion by regulating CCNG1 through regulating EMT. A, The number of migration and invasion cells in the CCNG1 overexpression group was increased. The numerical values were mean ± SD of three replicates. B, Extracts from the cells were analyzed for EMT marker protein N‐cad, slug, and snail expression by WB
