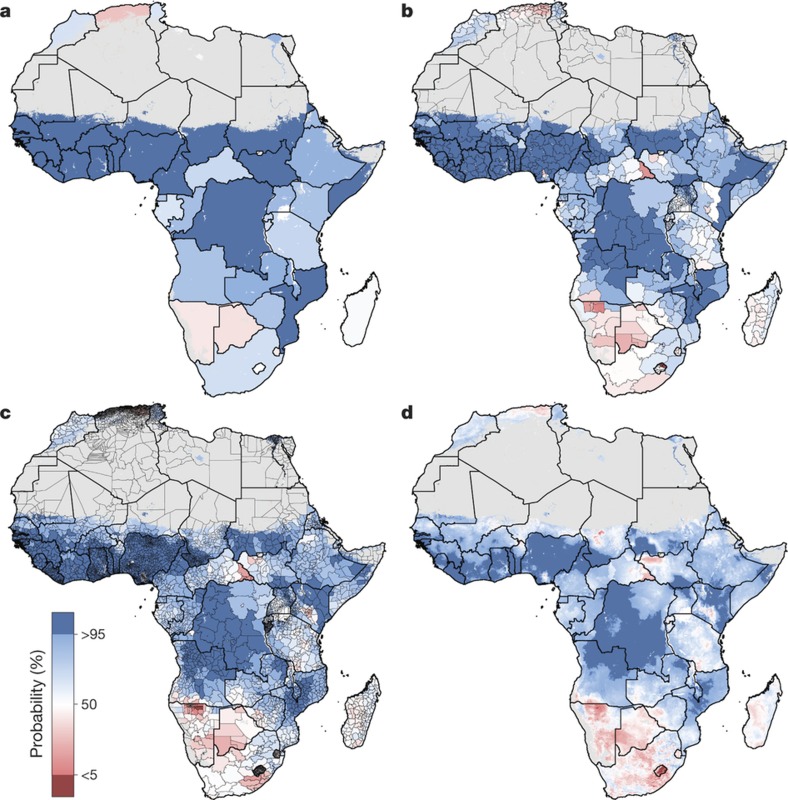
Figure 3. Probability that male educational attainment is greater than female educational attainment for men and women aged 15–49 in 2015.
a–d, Probabilities at the pixel level (d) were aggregated using 5 × 5-km resolution population data to the district level (c), province level (b) and national level (a). Maps reflect administrative boundaries, land cover, lakes and population; pixels with fewer than ten people per 1 × 1 km and classified as ‘barren or sparsely vegetated’ are coloured in grey32,36,37,38,39,40.

