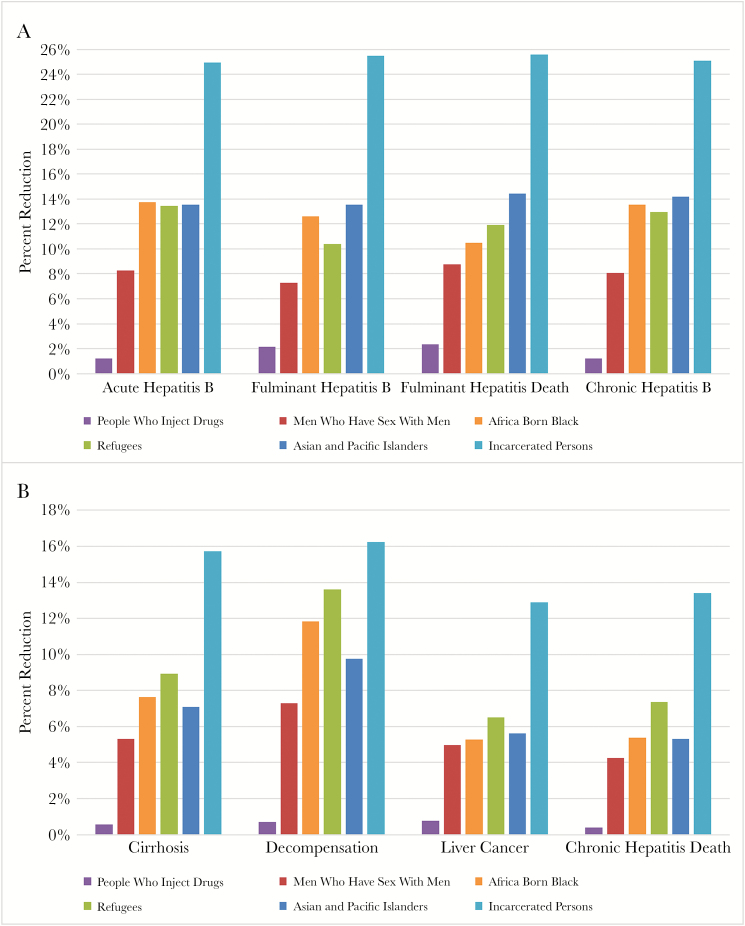
Figure 2.
Percent reduction in short/intermediate-term and long-term clinical outcomes with screen and treat or vaccinate strategy compared with no intervention for all study populations. Percentages for reduction in cases were calculated per 1 million patients vaccinated or treated using 1 million Monte Carlo simulations. The figures show, for every 1 million patients for each study population, the percentage of short/intermediate-term (A) and long-term (B) clinical outcomes that could be reduced by employing a program that either treats or vaccinates patients compared with no intervention.

