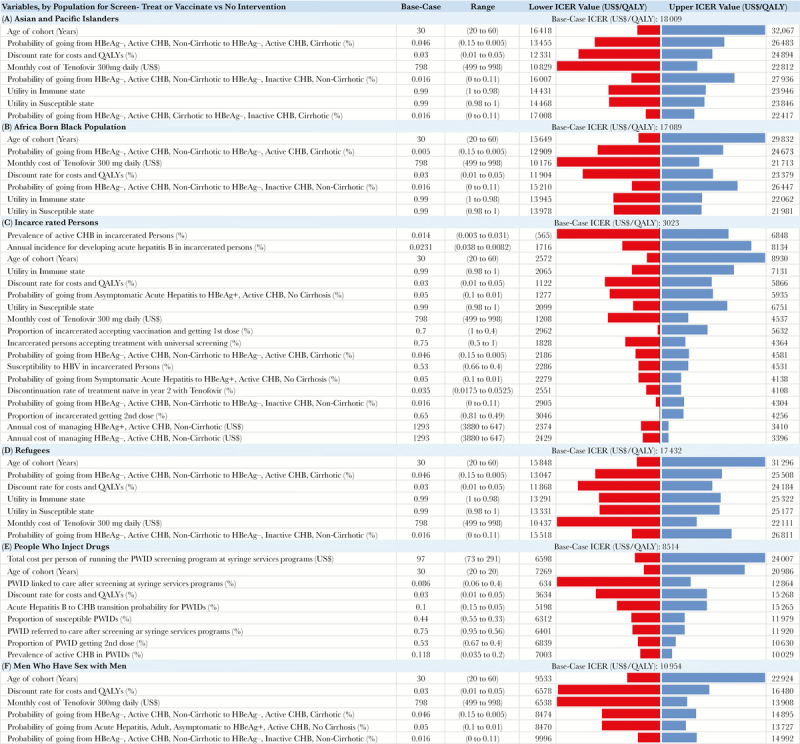
Figure 3.

Sensitivity analysis for the inclusive strategy compared with no intervention for each population. The figure shows variables with >30% effect on the incremental cost-effectiveness ratio (ICER) for each population. Red bars indicate the lower ICER for the value listed first in the range; blue bars indicate an increase for the second value in the range. Cost-effectiveness of the inclusive strategy compared with no intervention was sensitive to multiple inputs. For example, a high annual transition from noncirrhotic to cirrhotic states decreased the ICERs across populations. The decrease is because, as the transition to cirrhosis (worse health state) increases, the clinical value of treating to prevent progression also increases. Conversely, a higher annual transition to inactive CHB (better health state) from immune active disease decreases treatment value, as patients would naturally move into less damaging CHB phases. However, even at the extreme upper and lower limits of uncertainty ranges, the ICERs remained very cost-effective for all populations at a cost of less $50 000 per QALY gained. Abbreviations: AHB, acute hepatitis B; CHB, chronic hepatitis B; HBeAg, hepatitis B e antigen (+ or -); ICER, incremental cost-effectiveness ratio; PWID, people who inject drugs; QALY, quality-adjusted life-year.
