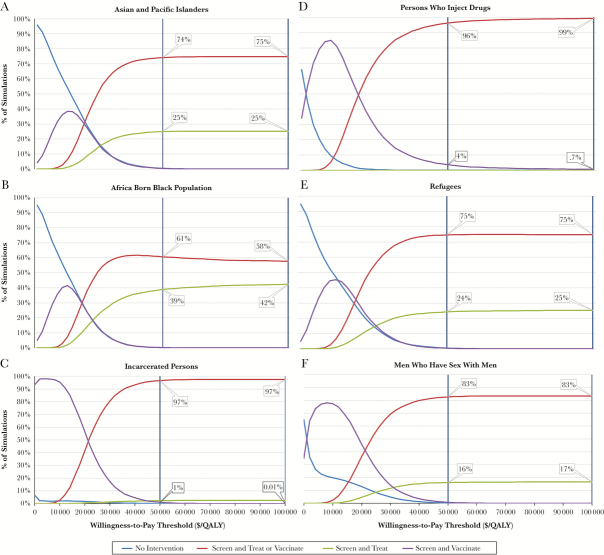
Figure 4.
Probabilistic sensitivity analyses of all intervention strategies for each population. The x-axis lists willingness-to-pay threshold in $/quality-adjusted life-year (QALY), whereas the y-axis shows the percentage of simulations in which a given strategy is cost-effective. For example, for the Asian and Pacific Islander population, at $50 000/QALY, the inclusive program to treat or screen was cost-effective 74% of the time, and screen and treat was cost-effective 25% of the time. Abbreviation: QALY, quality-adjusted life-year.

