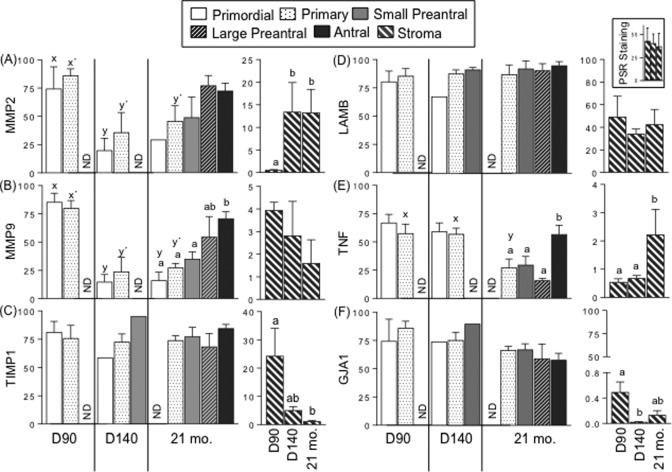
Figure 2.
Mean ± SEM of relative expression (measured as percentage of immunopositive area) of MMP2 (A), MMP9 (B), TIMP1 (C), LAMB (and stromal collagen as inset) (D), TNF (E), and GJA1 (F) in the granulosa cells of ovaries and stromal cells from control sheep of fetal D90 and D140 and adult 21-mo-old age are shown. Relative expression levels were measured in granulosa of primordial, primary, small preantral, large preantral and antral follicles, and in stromal cells. Relative collagen content was determined by the percent area positive for picrosirius red (PSR) staining. Different superscripts indicate significant differences as determined by analysis of variance followed by Tukey post hoc analysis; P < .05. Superscripts x and y are for comparison between ages in the same follicular class while superscripts a and b indicate comparison between the different follicular classes in 21-mo-old sheep. ND indicates not detectable; SEM, standard error of the mean; MMP, matrix metalloproteinase; TNF, tumor necrosis factor alpha; D90, fetal day 90; D140, fetal day 140.

