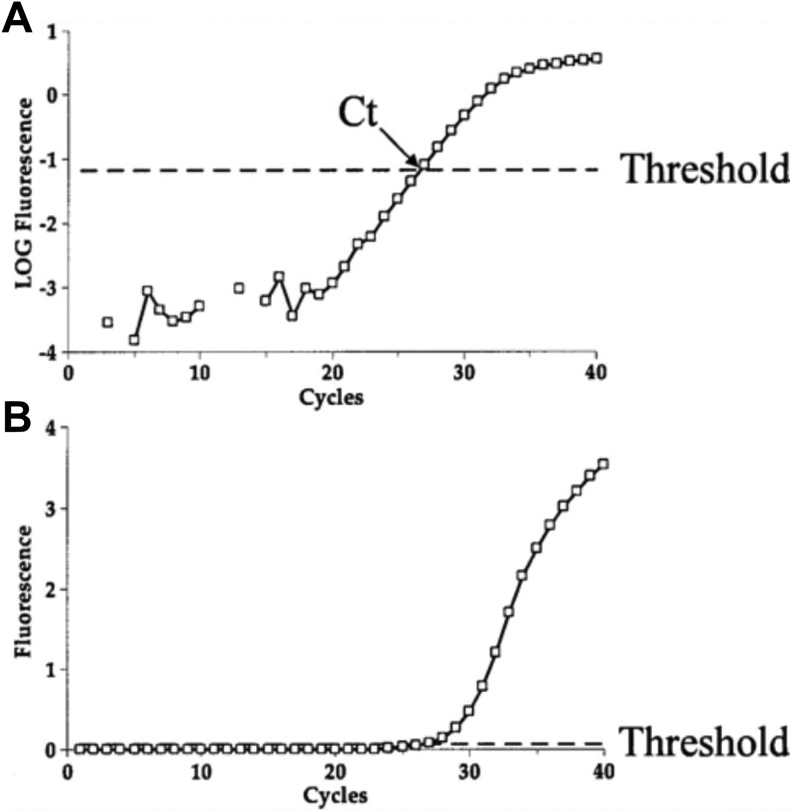
Figure 3.
The end result of real-time polymerase chain reaction (PCR) is the amplification plot. The x-axis is the PCR cycle, whereas the y-axis is the fluorescence that increases throughout the reaction. (a) Amplification plot on a logarithmic scale, demonstrating appropriate threshold. (b) Amplification plot on a linear scale, demonstrating the same threshold. Note that on a logarithmic scale, the linear phase appears to be a straight line. CT = crossing threshold. Source: Reprinted with the permission of Springer from Peirson and Butler (2007, fig. 3). Copyright 2007 by Humana Press.

