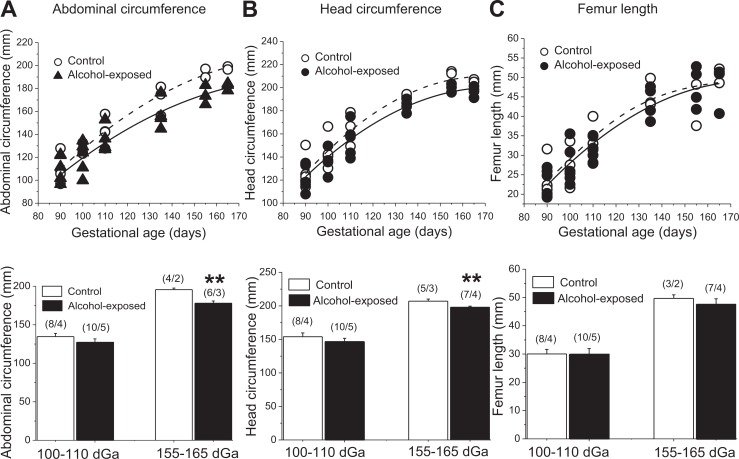
Figure 1.
Effect of fetal alcohol exposure on the overall fetal growth. A, Changes in abdominal circumference throughout gestation of control (hollow labels) versus alcohol-exposed (black labels) fetuses. Bottom bar graph is showing average of 2 repeated measures at 100 and 110 versus 155 and 165 dGa. **Statistically significant from control fetuses at 155 to 165 dGa; P < .01. B, Changes in head circumference throughout the gestation of control (hollow labels) versus alcohol-exposed (black labels) fetuses. Bottom bar graph is showing average of 2 repeated measures at 100 and 110 versus 155 and 165 dGa. **Statistically significant from control fetuses at 155 to 165 dGa; P < .01. C, Changes in femur length throughout the gestation of control (hollow labels) versus alcohol-exposed (black labels) fetuses. Bottom graph is showing average of 2 repeated measures at 100 and 110 versus 155 and 165 dGa.

