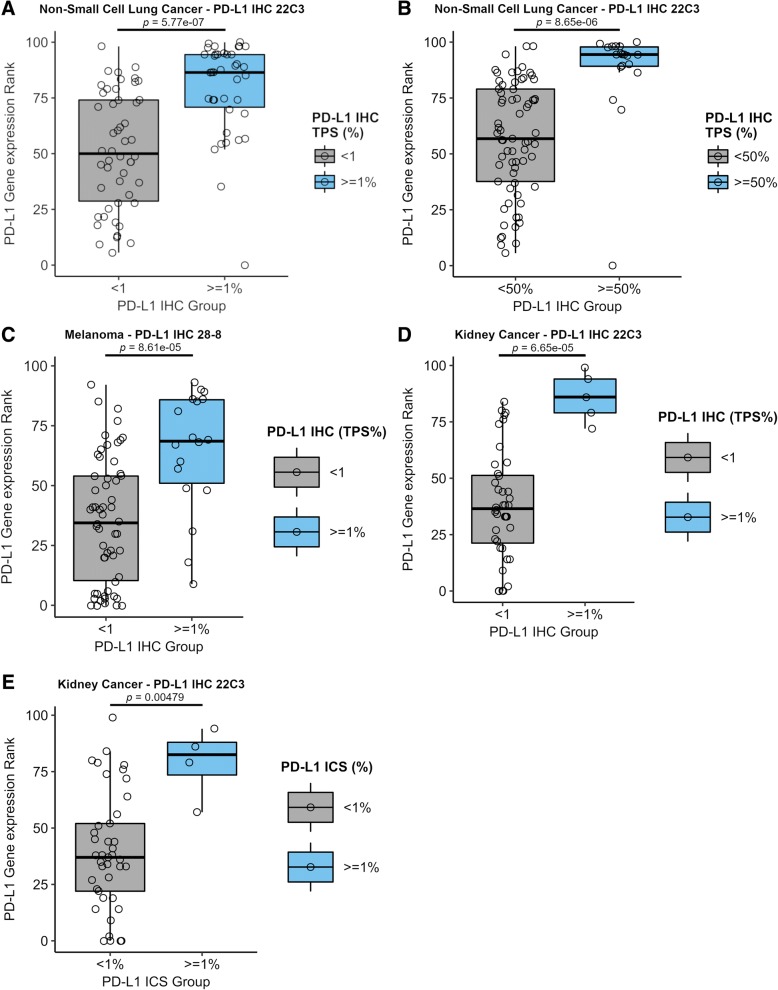
Fig. 2.
Ad-hoc Tukey’s HSD test comparing PD-L1 expression by RNA-seq (Y axis) with IHC (X axis). Box plots show concordance of the two measurements across multiple clinical cutoffs for IHC and different tumor types. a NSCLC mean TPS at < 1%. b NSCLC mean TPS at < 50%. c Melanoma TPS mean at < 1%. d RCC mean TPS < 1% or E) ICS < 1%

