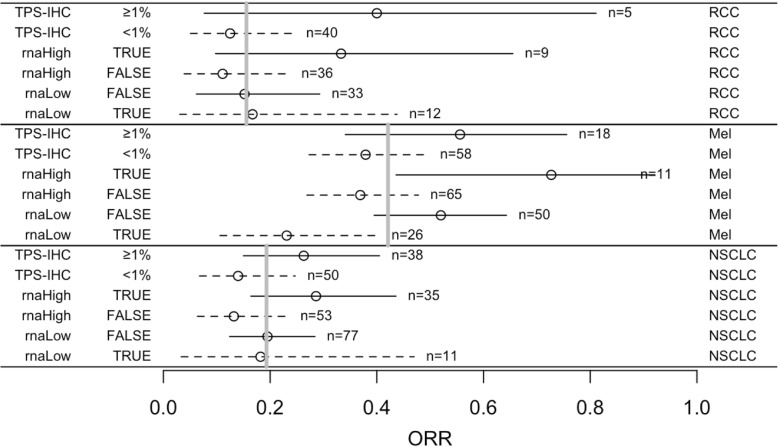
Fig. 3.
Proportions of responses in subgroups defined by tests for PD-L1 expression. Objective response rate (ORR) was 42.1% for melanoma (Mel), 15.6% for renal cell carcinoma (RCC), and 19.3% for non-small cell lung carcinoma (NSCLC) (grey bars). Each complementary pair of subsets corresponds to positive predictive value (PPV, solid line) and 1 – negative predictive value (NPV, dashed line) (circles). The intervals are 90% confidence intervals. TPS-IHC = PD-L1 tumor proportion score (TPS) by IHC, rnaHigh TRUE = PD-L1 RNA-seq expression is high, rnaHigh FALSE = PD-L1 RNA-seq expression is low or moderate (considered “negative”), rnaLow TRUE = PD-L1 RNA-seq expression is low, rnaLow FALSE = PD-L1 RNA-seq expression is moderate or high (considered “positive”)

