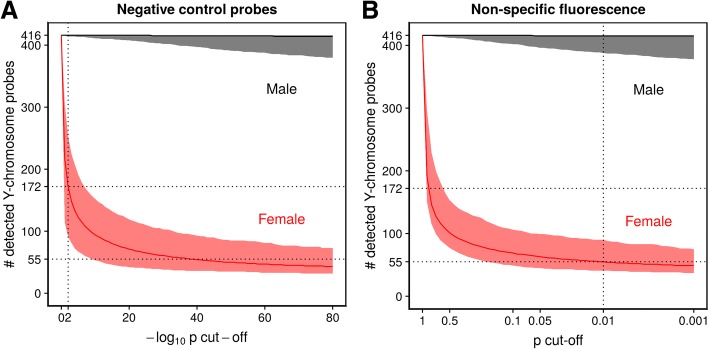
Fig. 1.
Choosing the right cut-off. Median number (with 2.5th and 97.5th percentiles) of detected Y-chromosome probes among 1313 male and 1442 female samples for a range of detection p value cut-offs. Negative control probes were used to estimate the background noise distribution in the left panel, whereas non-specific fluorescence was used in the right panel. The cut-off 0.01 (corresponding to 2 in the left panel due to the transformed x-axis) is highlighted

