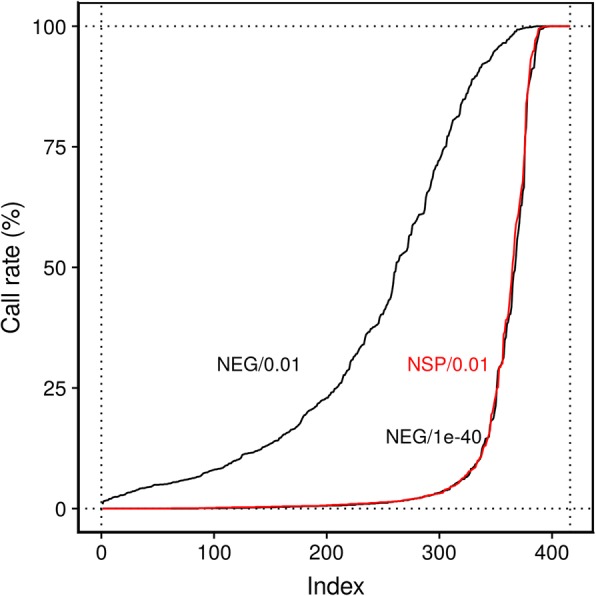
Fig. 2.

Detecting what is not supposed to be there. Call rates of Y-chromosome probes among the 1442 female samples for three approaches to classifying detected probes. Probes are ordered on the x-axis by increasing call rate (order not identical between curves). Only six probes had a call rate < 2% when using the conventional cut-off of 0.01 with the background distribution estimated from negative control probes (NEG/0.01). For more stringent criteria (NSP/0.1 and NEG/1e−40), there is an almost clear-cut separation between undetected and detected probes including some cross-hybridizing to autosomal CpG sites
