Fig. 8.
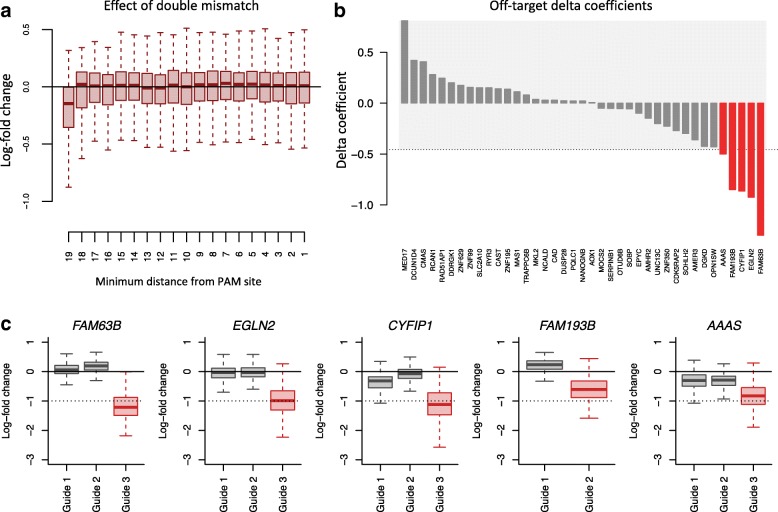
Position-specific mismatch tolerance of the spacer for double-mismatch alignments. a Effect of a double mismatch between spacer and reference genome as a function of the most PAM-proximal mismatch position. b Off-target delta coefficients for 39 genes targeted with a guide with at least 5 double-mismatch alignments with the first mismatch located at the 20th position. The gray-shaded area represents a 95% confidence interval of a null distribution of delta coefficients estimated using 1000 genes chosen at random that are targeted by clean guides only. c Distribution of LFCs for clean guides (gray boxplots) versus problematic guides (red boxplots) for the top 5 genes with an exceedingly large negative off-target delta coefficient from b

