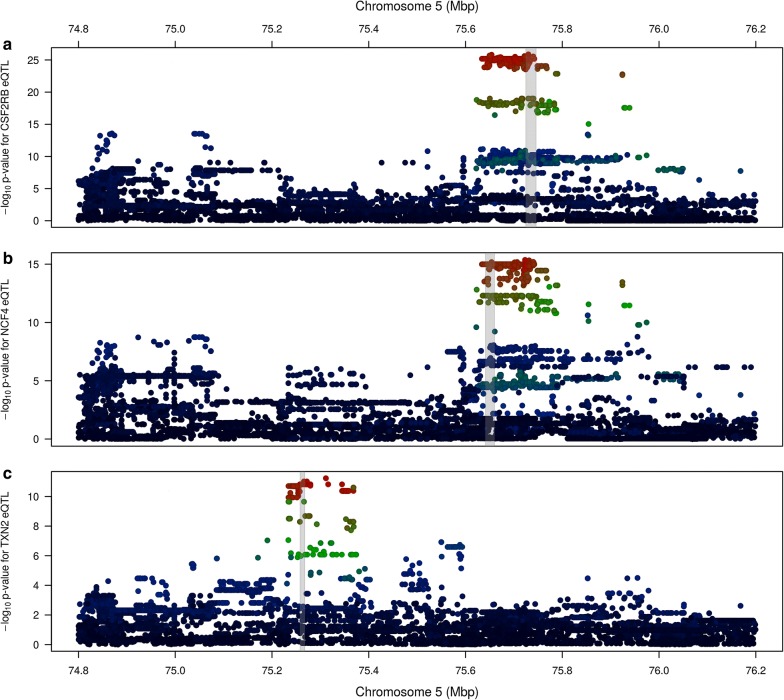
Fig. 3.
QTL plots showing eQTL for the three genes that exhibit genome-wide significant cis-eQTL (Table 3). From top to bottom, the three genes are a CSF2RB, b NCF4, and c TXN2. Colours represent correlations for each marker with the top variant for that eQTL (see Fig. 1 for legend). Grey bands indicate the location of the gene for which the eQTL is displayed

