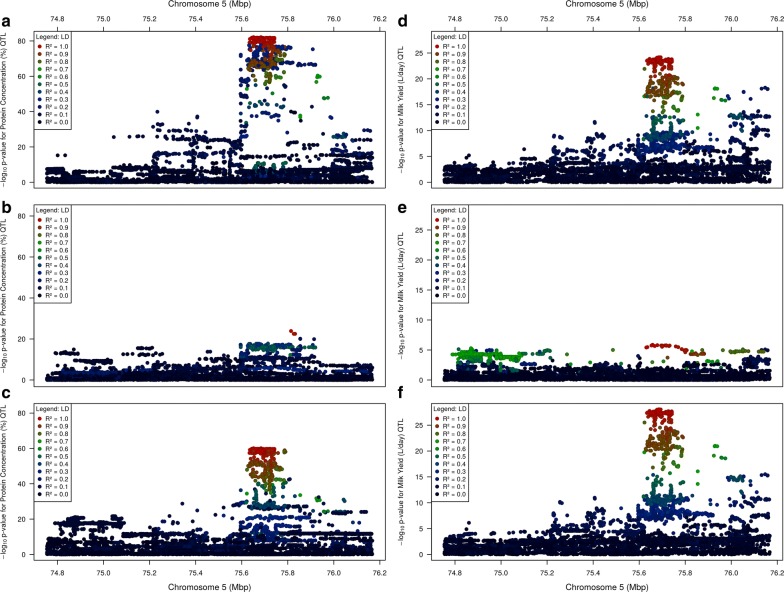
Fig. 5.
The effect of fitting the top variant on protein concentration (a–c) and milk yield (d–f) QTL. The top panels a and d show the QTL with no marker adjustments fitted; the centre panels b and e show the QTL after fitting the top variant from the panel above; and the bottom panels c and f show the QTL after fitting the top variant from the centre panel above. The phenotypes were adjusted by fitting the following markers: b rs208375076, c rs210293314, d rs208473130, e rs378861677

