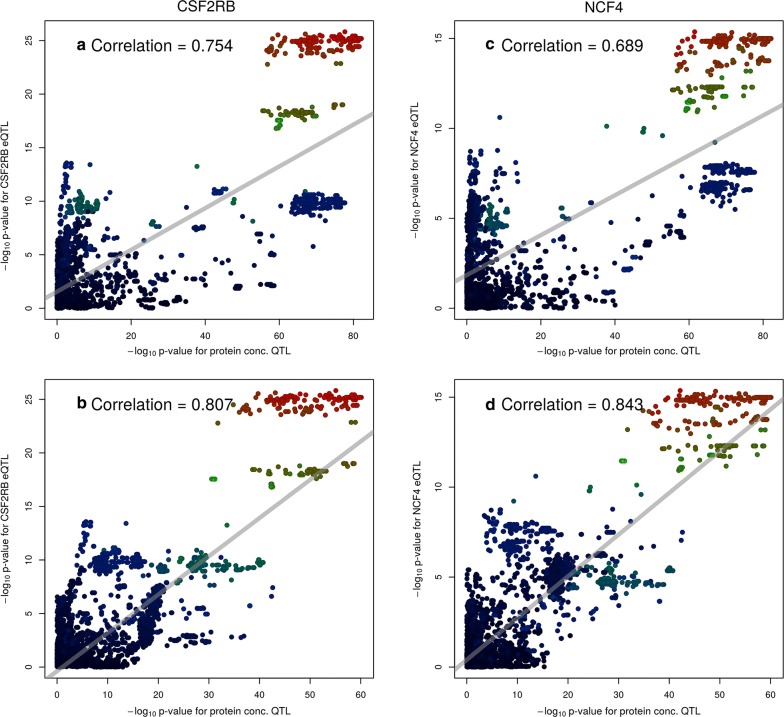
Fig. 6.
Correlations between eQTL and the co-located protein concentration QTL for the genes CSF2RB (left) and NCF4 (right). Panels on the top row are plotted against the original protein concentration QTL (Fig. 5a), while panels on the bottom row are plotted against the phenotype after fitting rs210293314 (Fig. 5c)

