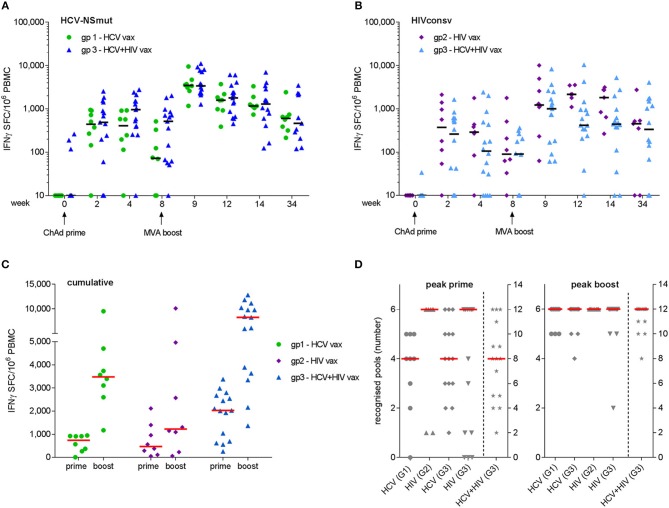
Figure 3.
Frequency of antigen-specific T cells as determined by fresh ex vivo IFN-γ ELISpot assays. Mock-subtracted values are shown. Summed responses to peptide pools spanning (A) NSmut in Group 1 (green) and Group 3 (blue) volunteers and (B) HIVconsv in Group 2 (purple) and Group 3 (light blue) volunteers. Black horizontal bars indicate median values. (C) Cumulative responses (sum of NSmut and HIVconsv) in Group 3 subjects are compared with responses to the same immunogens when administered as a single regimen. (D) Breadth (number of peptide pools eliciting a positive response) at the time of the peak response to priming and boosting vaccinations. Group 3 (G3) values in right hand columns indicate the sum of HCV and HIV pools recognized. For (C,D), red bars indicate median values.

