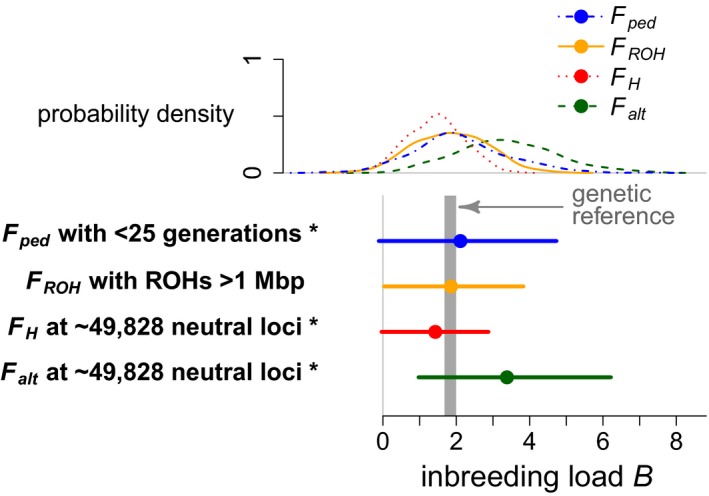
Figure 2.

Inbreeding load estimated in a Poisson GLM with logarithmic link function and various metrics of inbreeding coefficient F (see main text and Table 3 for details). Curves on top of the panel show probability densities of inbreeding load estimates across all 280 analysed demes. Horizontal lines in the lower part of the panel show the 2.5% to 97.5% quantiles, and dots indicate mean estimates across all 280 demes. Asterisks (*) indicate that the mean estimate was different from the true value of inbreeding load with a p‐value of <5%. F ped (blue) was based on up to 25 ancestral generations. F ROH (orange) was based on runs of homozygosity of at least 1 Mbp. F H (red) and F alt (green) were calculated using all polymorphic neutral loci. The grey area (genetic reference) spans from the 2.5% quantile (1.68 lethal equivalents) to the 97.5% quantile (1.99 lethal equivalents) of actual inbreeding load calculated from the observed allele frequencies and selection coefficients at deleterious loci using equation 1
