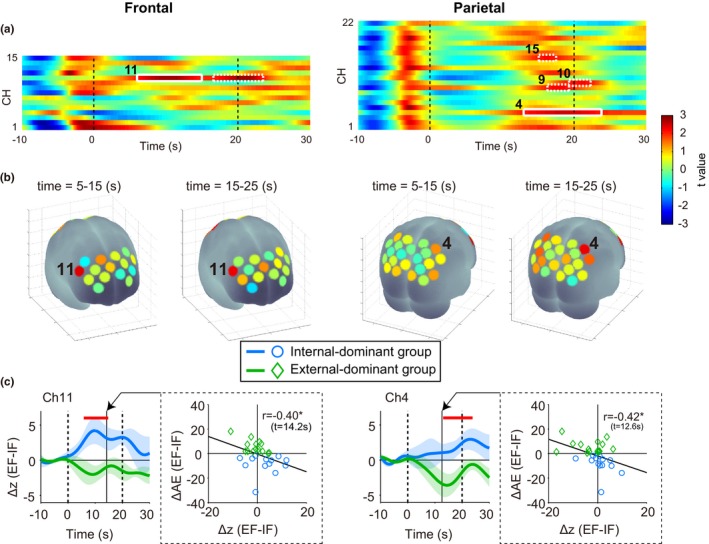
Figure 4.

Spatiotemporal characteristics of frontal (left column) and parietal (right column) neural activities reflecting individual optimal attentional strategy. (a) Significant differences in neural activity at ch.11 of the frontal area and ch.4 of the parietal area were observed between Internal‐ and External‐dominant groups (solid white squares, p < 0.05, cluster‐based permutation test). (b) Spatial configuration. The t values of time averages are superimposed onto a brain surface. (c) The temporal profiles of differential z scores at channels with significant differences between dominance groups and the correlations between the differential z scores and differential after‐effect sizes at the time with the highest correlation coefficient. *p < 0.05
