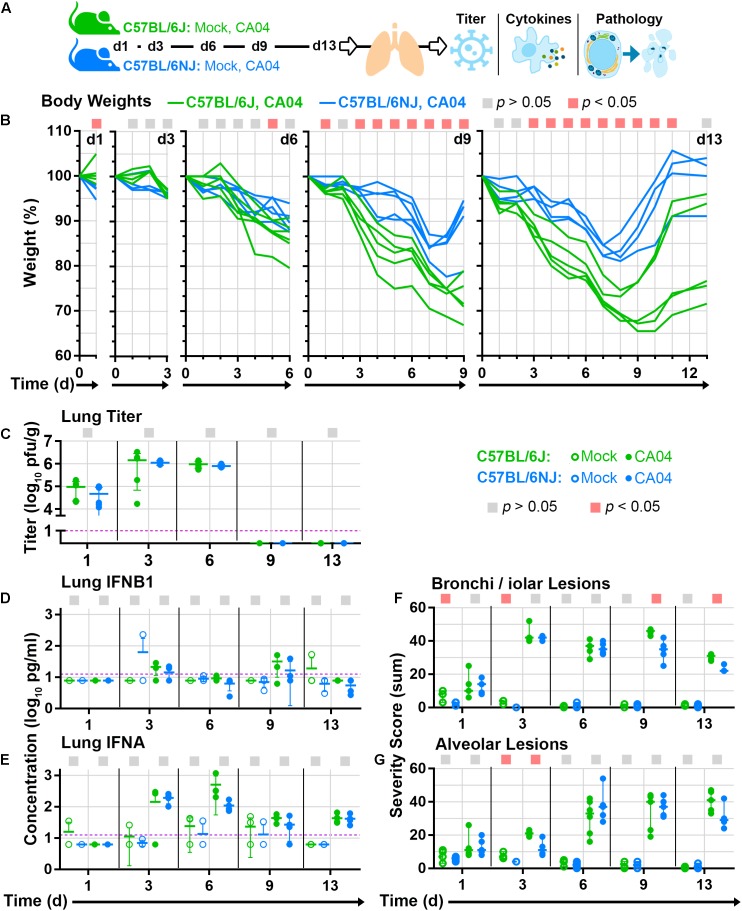
FIGURE 3.
Lung tissue analyses. Groups C57BL/6J or C57BL/6NJ mice were mock-infected (with PBS) or infected with a sub-lethal dosage (3.4 × 10⁴ pfu) of CA04, euthanized at five time points [day 1 (d1), d3, d6, d9, and d13; four to six mice were euthanized per group at each time point], and lung tissues were collected and divided for various analyses. (A) Overview of mouse lung tissue collection time points and subsequent analyses. (B) Individual mouse body weight ratio profiles are shown for CA04-infected C57BL/6J and C57BL/6NJ mice in each time point group. (C) Individual lung titers are shown for each CA04-infected mouse at each time point. Concentrations of (D) IFNB1 or (E) IFNA in lung homogenates are shown for individual mock-infected and CA04-infected mice at each time point. Individual histopathology sum severity scores of (F) bronchi/iolar lesions and (G) alveolar lesions are shown for mock-infected and CA04-infected mice at each time point (see Supplementary Table S1 for all histopathology scoring data). In (A–G), the colored squares at the top of each graph indicate statistically significant differences between C57BL/6J and C57BL/6NJ for a given comparison. In (C–E), group means are shown by horizontal bars, error bars indicate standard deviation, and the limit of detection is represented by a dashed purple line. In (F,G) group medians are shown by horizontal bars and error bars indicate the 95% confidence interval. d, day; pg, picograms; g, gram; ml, milliliter.

