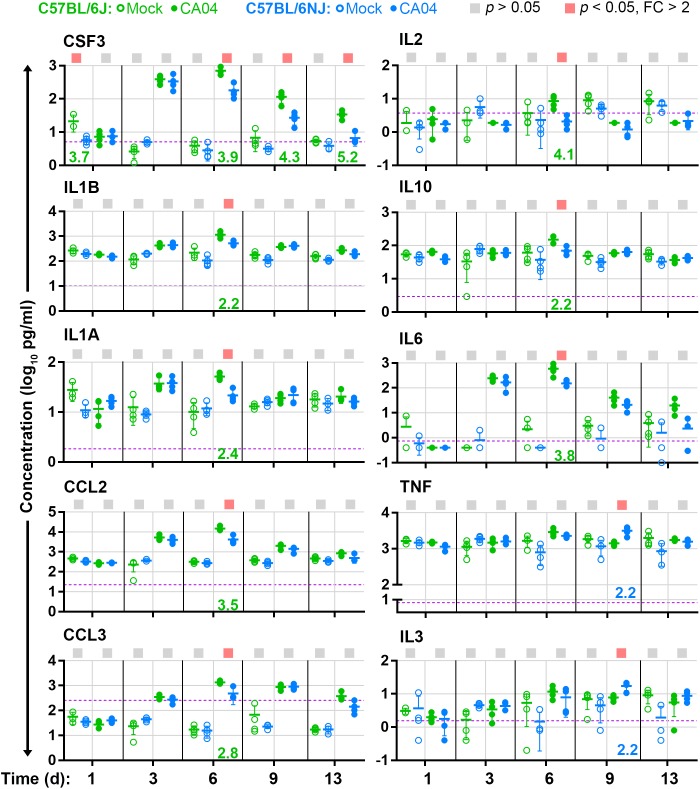
FIGURE 5.
Lung cytokine levels. For cytokines that are differentially expressed (fold change [FC] > 2, Holm–Sidak-adjusted p < 0.05) in concentration between CA04-infected C57BL/6J and C57BL/6NJ mice in at least one time point, the concentrations [picograms (pg) per ml] in lung homogenates are shown for individual mock-infected and CA04-infected mice for all time points. Group means are shown by horizontal bars, error bars indicate standard deviation, and the limit of detection is represented by a dashed purple line. Colored squares at the top of each graph indicate statistically significant differences between C57BL/6J and C57BL/6NJ for a given comparison. Fold-changes associated with statistically significant comparisons are indicated at the bottom of each graph (green text indicates higher expression in C57BL/6J mice, and blue text indicates higher expression in C57BL/6NJ mice). See Supplementary Table S2 for all cytokine data.

