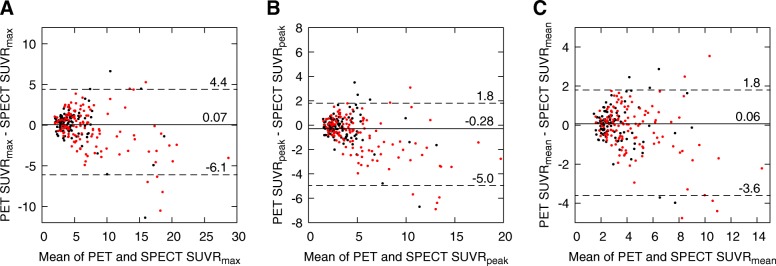
Fig. 5.
Bland-Altman plots of a SUVRmax, b SUVRpeak, and c SUVRmean from SPECT and PET data for all lesions. The x-axis represents the mean of SPECT and PET SUVRs and the y-axis the difference between SPECT and PET SUVRs. Metastatic lesions are marked in red and benign in black. Solid lines with numerical values denote median differences and dotted lines with values denote 95% LOA

