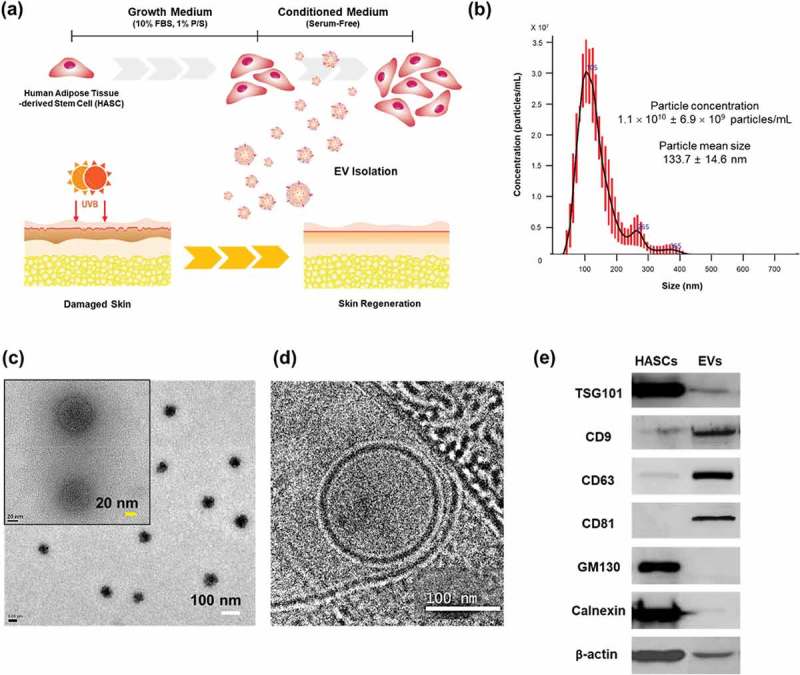
Figure 1.

Characterization of EVs secreted from HASCs. (a) Schematic representations of EV isolation from HASCs and the EV treatment of UVB-induced skin ageing. (b) Nanoparticle tracking analysis (NTA) showing the concentration of the EVs. (c) Classic and (d) cryogenic transmission electron microscope (TEM) pictures of EVs. The scale bars represent 100 nm (white) and 20 nm (yellow). (e) Western blot analysis of EVs. Expression of EV markers (TSG101, CD9, CD63 and CD81) and internal protein markers (GM130 and Calnexin).
