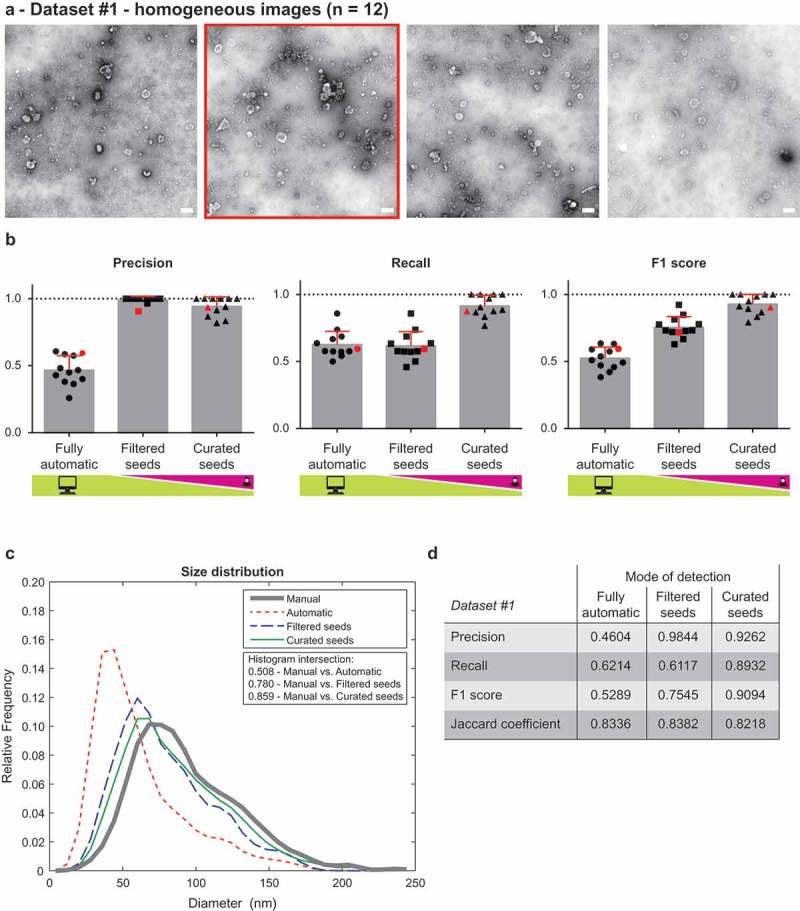
Figure 2.

Performance of TEM ExosomeAnalyzer – homogeneous dataset.
The performance of TEM ExosomeAnalyzer was compared with images manually annotated by experts. (a) Four representative images from a small (12 images) homogeneous dataset with all samples prepared and images taken on the same day using identical magnification. The white bar represents 200 nm in each image. (b) Graphs showing performance of the software tool in three categories – Precision (left panel), Recall (middle panel) and F1 score (right panel), each time for three different modes (fully automatic, filtered seeds and curated seeds – as described in Figure 1). Each symbol in the graphs corresponds to result for one image. Red colour highlights performance of the software tool for the second image from (a) which was chosen as an example. In Filtered seeds all wrong seeds are removed, therefore all the remaining ones are correct leading to nearly perfect Precision, however, some EVs have still not been detected (no seeds had been added), therefore there is no improvement in terms of number of correctly recognised EVs (Recall), which can be observed as no difference between Fully automatic and Filtered seeds in Recall. (c) The software tool performance depicted as histogram of relative frequencies with respect to diameter of detected EVs. Histograms for manually annotated images and for images analysed by TEM ExosomeAnalyzer are shown together with intersections of manual detection with each of the evaluated modes. (d) Table summarising the results from dataset analysis at the level of individual EVs (not on image levels as in (b)).
