
Figure 5.
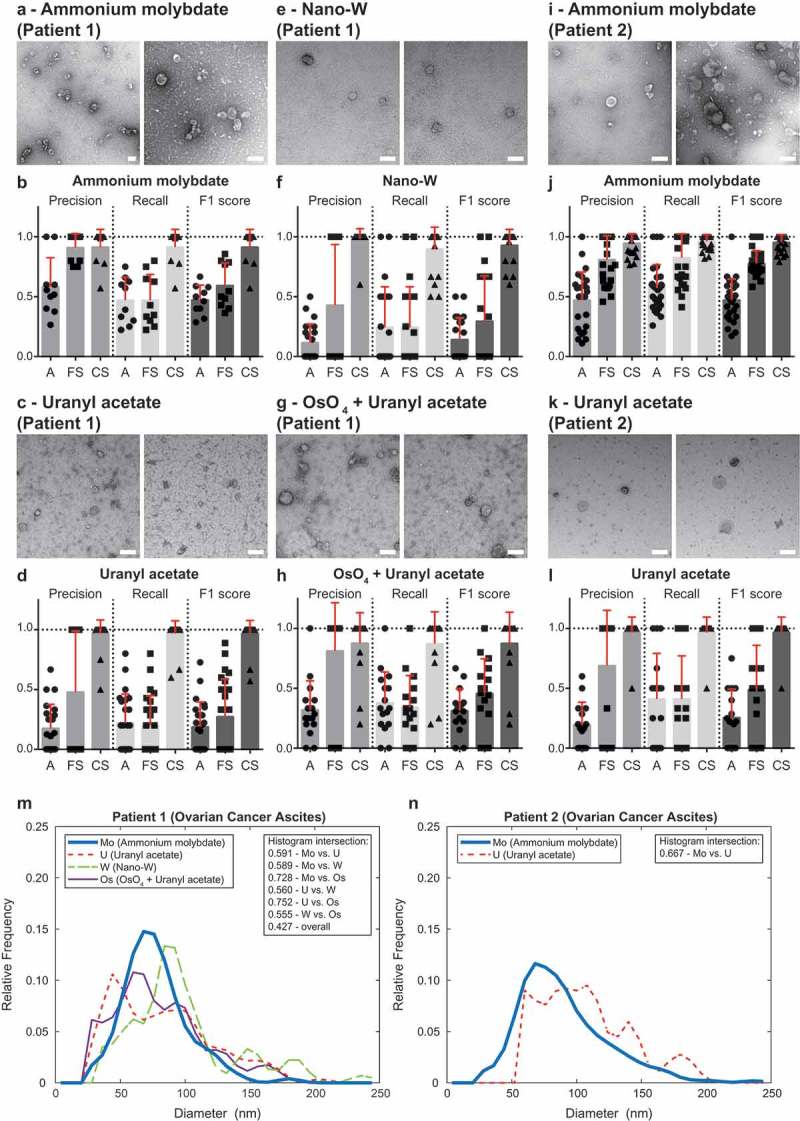
Performance of TEM ExosomeAnalyzer – different negative staining methods.
The performance of TEM ExosomeAnalyzer with respect to different negative staining protocols was performed. The white bar represents 200 nm in each image. Representative images and performance of the software in three modes (A – fully automatic, FS – filtered seeds, CS – curated seeds) are shown for EVs isolated from patient ovarian cancer ascites. Each symbol in the graphs corresponds to result for one image. Patient 1 ascites EVs were stained with ammonium molybdate (a and b), uranyl acetate (c and d), nano-W (e and f) and osmium tetroxide + uranyl acetate (g and h). Patient 2 ascites EVs were stained only by ammonium molybdate (i and j) and uranyl acetate (k and l). Comparison of size distribution profiles of EVs obtained by TEM ExosomeAnalyzer (in CS mode) using different staining techniques (m – patient 1, n – patient 2). High level of performance and similar size distribution profiles of EVs were achieved with all protocols tested.