Figure 4.

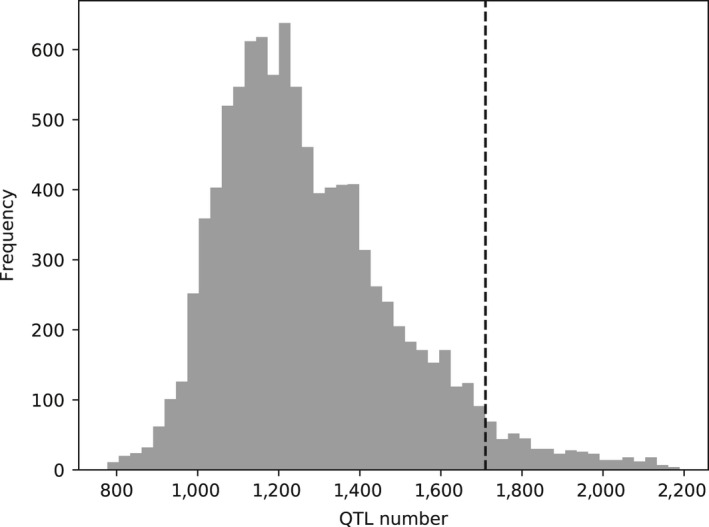
The number of QTLs in 50‐kb windows with more than 50% Chinese ancestry. The histogram is the null distribution of QTL numbers simulated by permutation test. The dashed line indicates the observed number of QTLs

The number of QTLs in 50‐kb windows with more than 50% Chinese ancestry. The histogram is the null distribution of QTL numbers simulated by permutation test. The dashed line indicates the observed number of QTLs