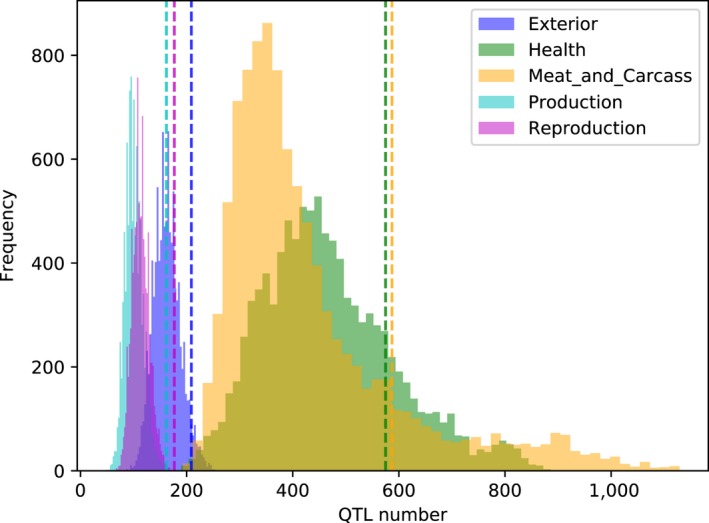
Figure 5.

The number of QTLs associated with meat and carcass, production, reproduction, health, and exterior traits in 50‐kb windows with more than 50% Chinese ancestry. The histograms are the null distributions of number of QTLs associated with each trait group by permutation test. The dashed line indicate the observed number of QTLs associated with each trait group
