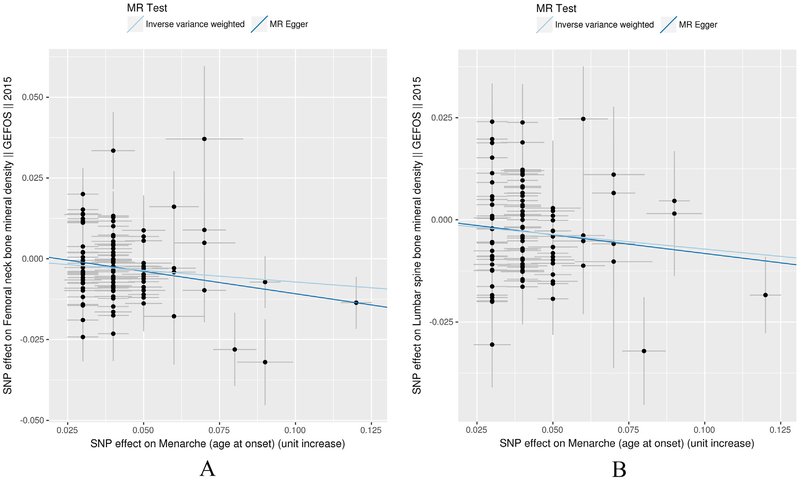
Fig. 1.
IVW and MR-Egger regression scatterplot for AAM on FNK (A) and LS BMD (B) analysis. The light blue line shows the results of standard MR analysis (inverse-variance weighting [IVW]), and the dark blue line shows the pleiotropy-adjusted MR-Egger regression line. (For interpretation of the references to colour in this figure legend, the reader is referred to the web version of this article.)

