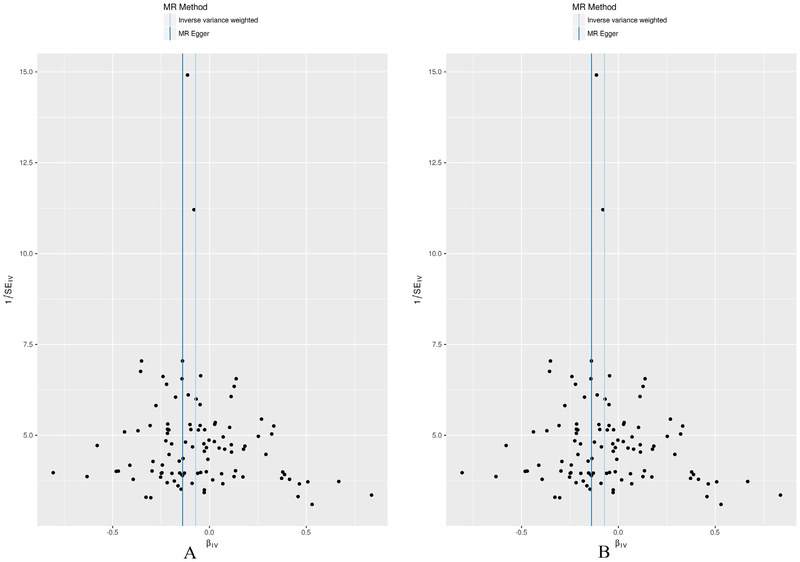
Fig. 2.
MR-Egger regression funnel plot for AAM on FNK (A) and LS BMD (B) analysis. Each SNP’s MR estimate is plotted against its minor allele frequency corrected association with AAM. A minor allele frequency (MAF) correction proportional to the SNP-AAM standard error is used since a low-frequency allele is likely to be measured with low precision. Similar to the use of funnel plots in the meta-analysis literature, this plot can be used for visual inspection of symmetry, where any deviation can be suggestive of pleiotropy. We note that our plot appears generally symmetrical.

