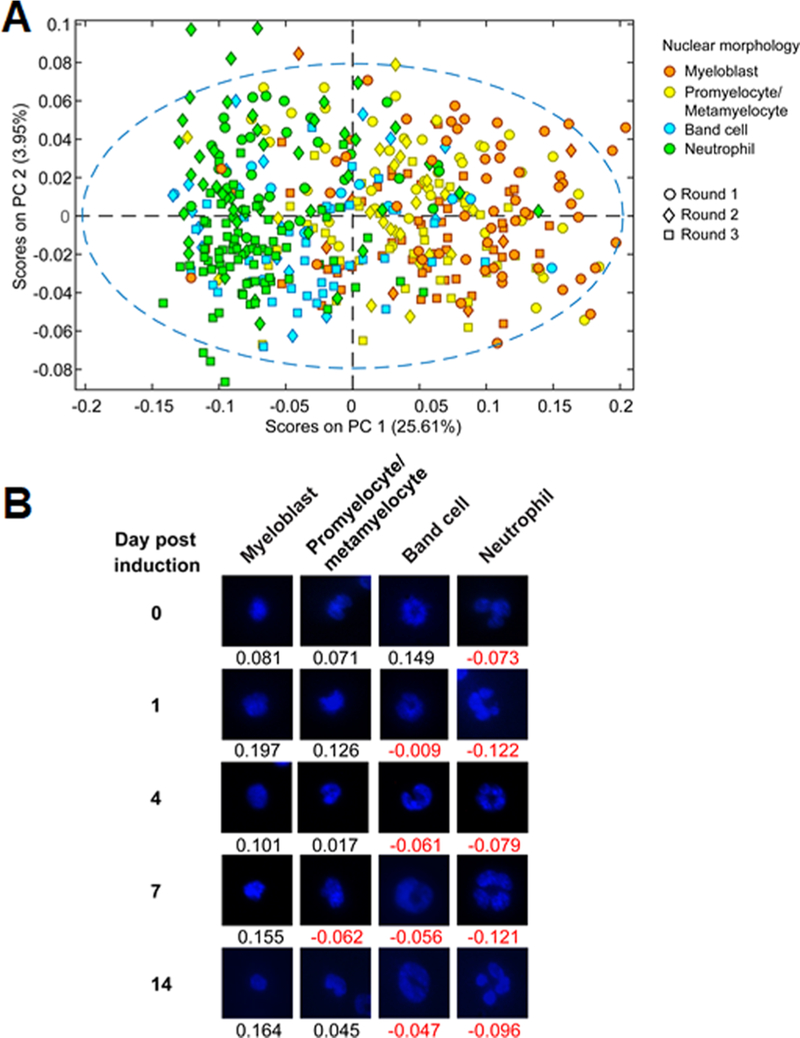
Figure 5.
32D cell lineage specification from independent rounds of differentiation. (A) PCA plot of 32D cell spectra combined from three differentiation rounds. (B) Representative cell nuclei images corresponding to the four differentiation states were selected from days 0, 1, 4, 7, and 14 from all three cycles and assigned PC1 scores from the above PCA plot.

