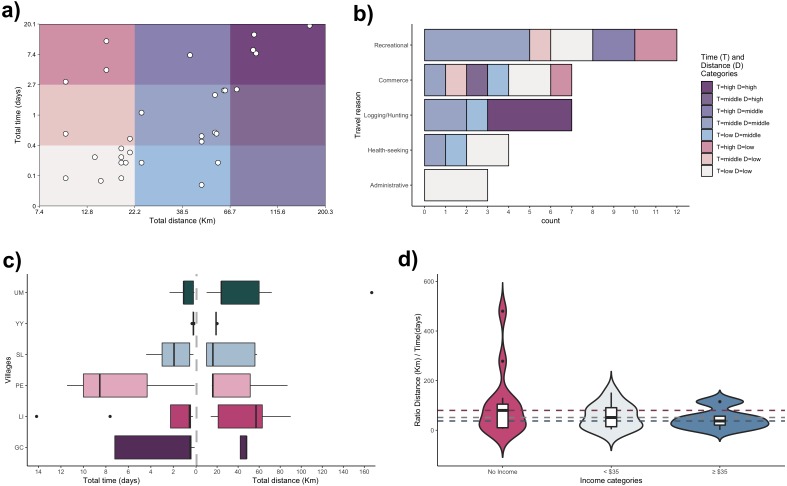
Figure 2. Mobility patterns of inhabitants of Mazan district.
(A) Distribution of profiles among categories of trip distance and time (X- and Y-axes in logarithmic scale). (B) Travel patterns per trip reason. (C) Distribution of travel time and distance between villages (villages abbreviations on Y-axis as in Fig. 1). (D) Stratified distribution of the ratio distance/time according to income.

