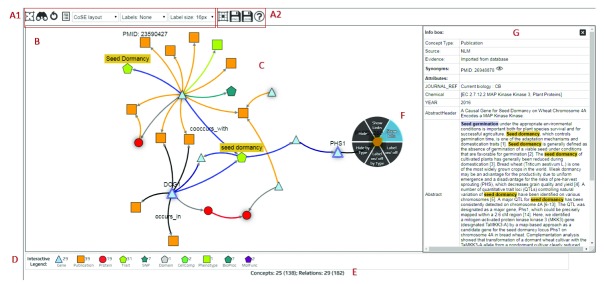
Figure 1. The main components of KnetMaps.
( A1) Display configuration (set network layout, node/edge visibility, label visibility and size). ( A2). Network export options (cytoscape JSON, PNG). ( B) Interactive network container (pan and zoom the network), ( C) Knowledge network rendering (displays nodes and edges of different types). ( D) Interactive legend (to overlay more linked entities to the visible network). ( E) Network summary statistics (indicates hidden and total nodes/edges). ( F) Touch-sensitive context menu (show further information about selected node/edge, hide selected entity or its label, show hidden linked entities). ( G) Item Information panel (display content-rich attributes of selected node/edge).

