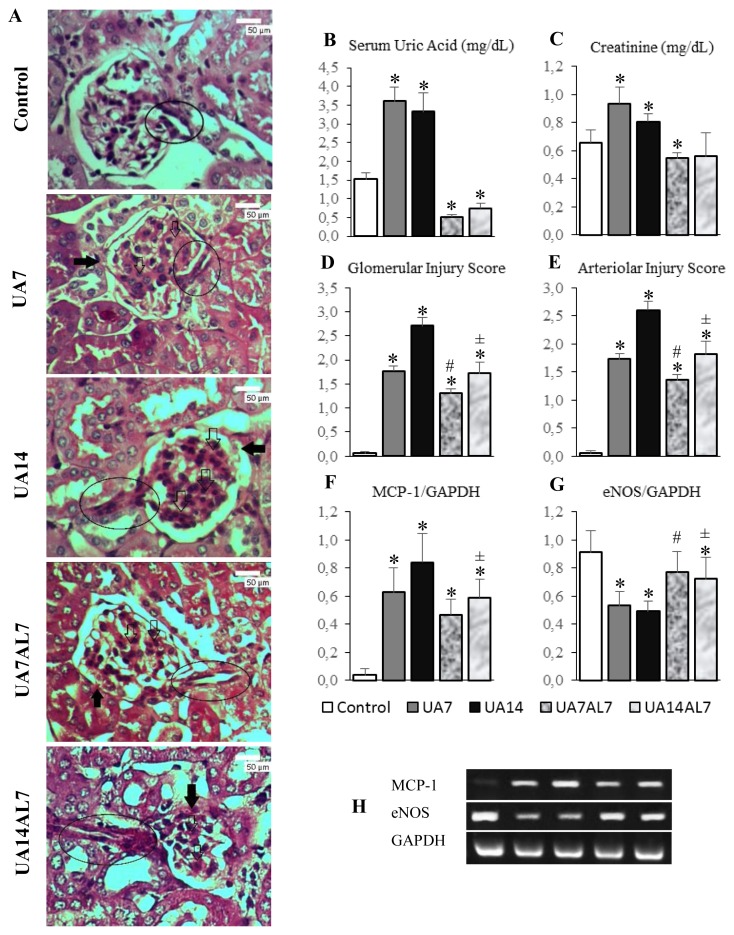
Figure 1.
(A) Histopathologic examination of mice kidneys with PAS staining, light microscope of 400 times magnification. Note: (➔) synechiae, (⇨) glomerulosclerosis, inside oval box: arteriole. Glomerular damage occured which was characterized by glomerulosclerosis, synechiae, and thickening of the basement membrane in all groups except the control. Glomerulosclerosis occured most severe in UA14 group. Afferent arteriolar was damaged in the form of narrowing lumen and hyalinosis. The most severe damage was on the UA14 group, where there was total obliteration of the lumen of the afferent arterioles. (B) Serum uric acid levels bar chart. (C) Serum creatinine levels. (D) Glomerular injury score bar chart. (E) Arteriolar injury score bar chart. (F) MCP-1 gene expression bar chart. (G) eNOS gene expression bar chart. (H) MCP-1, eNOS and GAPDH gene expression electrophoresis band. * = p <0.05 vs Control; # = p <0.05 vs UA7; ± = p <0.05 vs UA14

