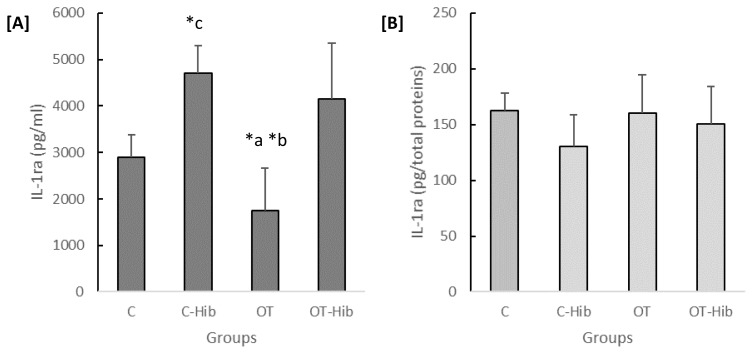
Figure 5.
The levels of IL-1ra in the blood plasma [A] and hippocampus [B]
*Description: One-way ANOVA ([A]: p<0.001) with post hoc Bonferroni tests: a) average level of plasma IL-1ra OT vs OT-Hib (p<0.05); b) average level of plasma IL-1ra OT vs C-Hib (p<0.001); c) average level of plasma IL-1ra C-Hib vs C (p<0.05). The data for the plasma IL-1ra levels [A] are presented as quantities (pg) of plasma volume (ml), and the data for the hippocampal IL-1ra levels [B] are presented as quantities (pg) of total protein content. OT: overtraining; OT-Hib: overtraining with H. sabdariffa; C-Hib: control with H. sabdariffa; C: control.

