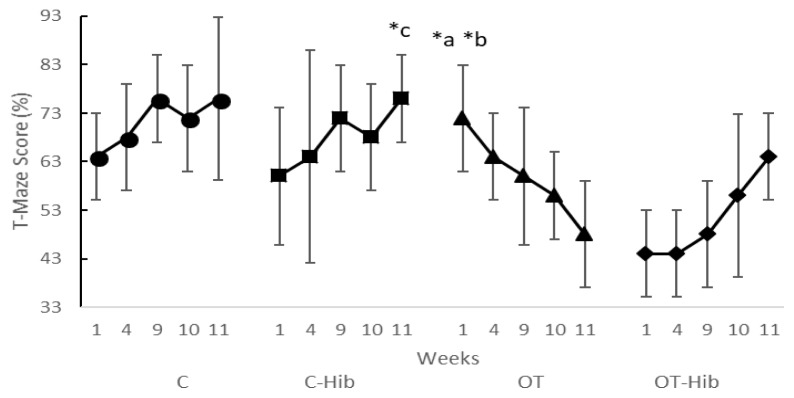
Figure 8.
Spatial Memory Consolidation T-Maze Scores Averaged for Each treatment group
*Description: Wilcoxon test = a) OT group, w-10 vs w-1 score (p<0.05); b) OT group, w-11 vs w-1 score (p<0.05); c) C-Hib group, w-11 vs w-1 score (p<0.05). w: the end of the week; OT: overtraining; OT-Hib: overtraining with H. sabdariffa; C-Hib: control with H. sabdariffa; C: control.

