
Figure 5.
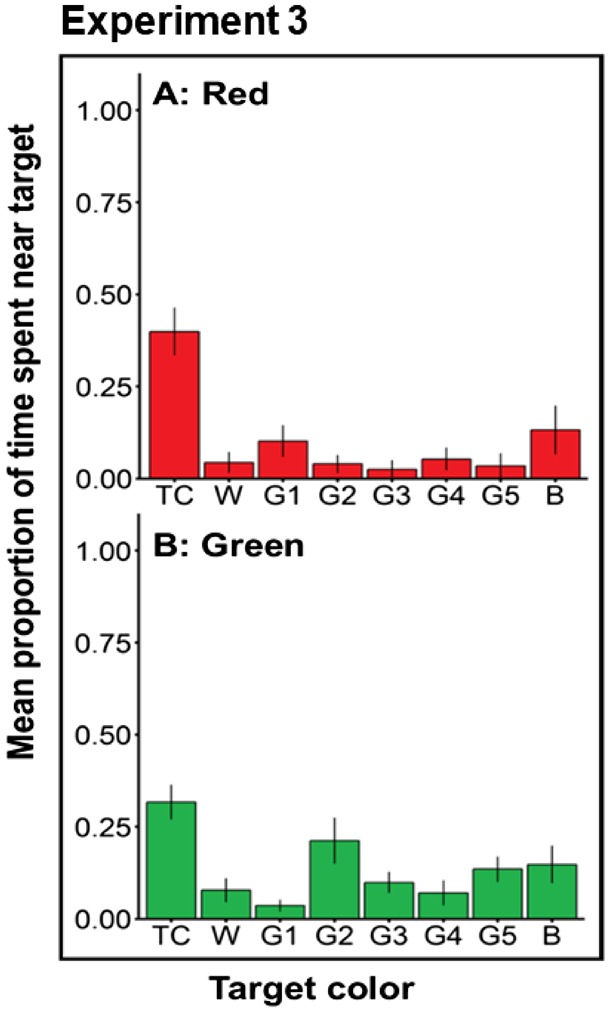
Experiment 3—Proportion of time spent near simultaneously presented stimuli during test trials (mean ± SE). Bar represents target colors presented to bass where TC = training color, W = white, G1–G5 = gray targets, and B = black. Each grid represents bass trained to A = red and B = green.