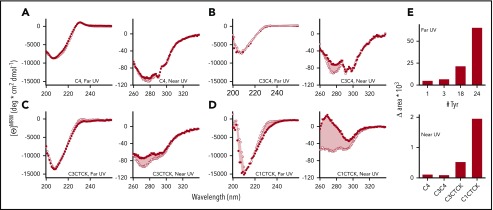
Figure 6.
CD spectra for Phe2561- (•,▪) and Tyr2561-VWF (○,□). (A) C4, (B) C3C4, (C) C3CTCK, and (D) C1CTCK. Near-UV (squares) and far-UV CD spectra (circles) are shown on the left side and right side of each panel, respectively. The pink shaded area indicates the area difference between Phe2561-VWF and Tyr2561-VWF in each construct. This difference (Δarea) is plotted in panel E as a function of the number of tyrosine residues in each protein construct.

