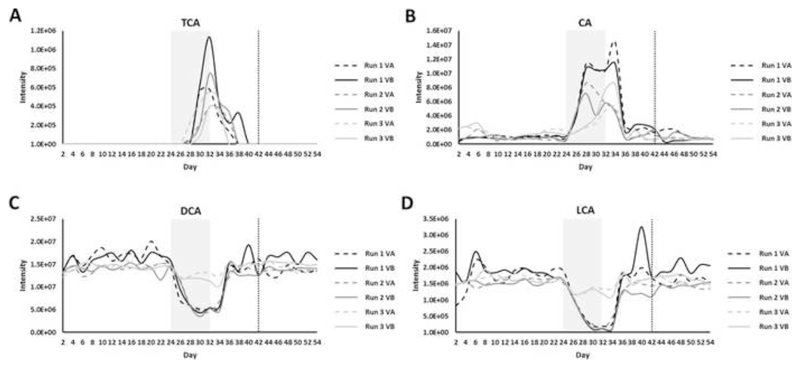
Figure 3.
Bile acids that changed following clindamycin treatment and correlated with C difficile TVC (VA= saline-treated cultures, dashed line; VB= FMT-treated cultures, solid line). (A) taurocholic acid (TCA), (B) cholic acid (CA), (C) deoxycholic acid (DCA), and (D) lithocholic acid (LCA). The shaded grey box indicates the clindamycin-dosing period, while the vertical dotted line indicates the day of FMT or saline dosing. Steady state cultures were compared to clindamycin-treated cultures using SANTA analysis with Benjamini-Hochberg FDR.

