FIGURE 2.
Projection of a 3D reconstruction of a pancreatic islet from a transgenic reporter strain
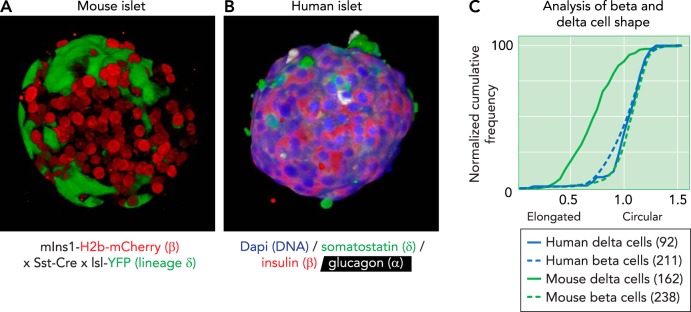
A: projection of a 3D reconstruction of a pancreatic islet from a transgenic reporter strain, captured by confocal microscope. β-Cells are visualized by the nuclear expression of an mCherry under control of the Ins1 promoter. δ-Cells are visualized by the expression of Cre recombinase under control of the somatostatin (Sst) promotor, which leads to their irreversible expression of yellow fluorescent protein (YFP; green). B: projection of a 3D reconstruction of a human pancreatic islet, captured by confocal microscope and stained for somatostatin (green), insulin (red), and glucagon (white). Nuclei (dapi) are counterstained in blue. Note how the human δ-cells are notably more compact compared with the axon-like mouse δ-cells. C: the difference in morphology of mouse and human δ-cells and β-cells from the same islet quantified their circularity, defined as the normalized ratio of the area over the perimeter of the cell outline. Each cell outline was determined in Nikon Elements, and circularity was calculated as . A value of 1 indicates a perfect circle. Mouse δ-cells stand out for their elongated morphology, which manifests as a significant reduction in circularity, compared with β-cells, whereas human δ-cells are similarly compact to human β-cells. Numbers in-between parentheses reflect the number of cells quantified from 3D confocal reconstructions of intact islets from two individual subjects for each species.

