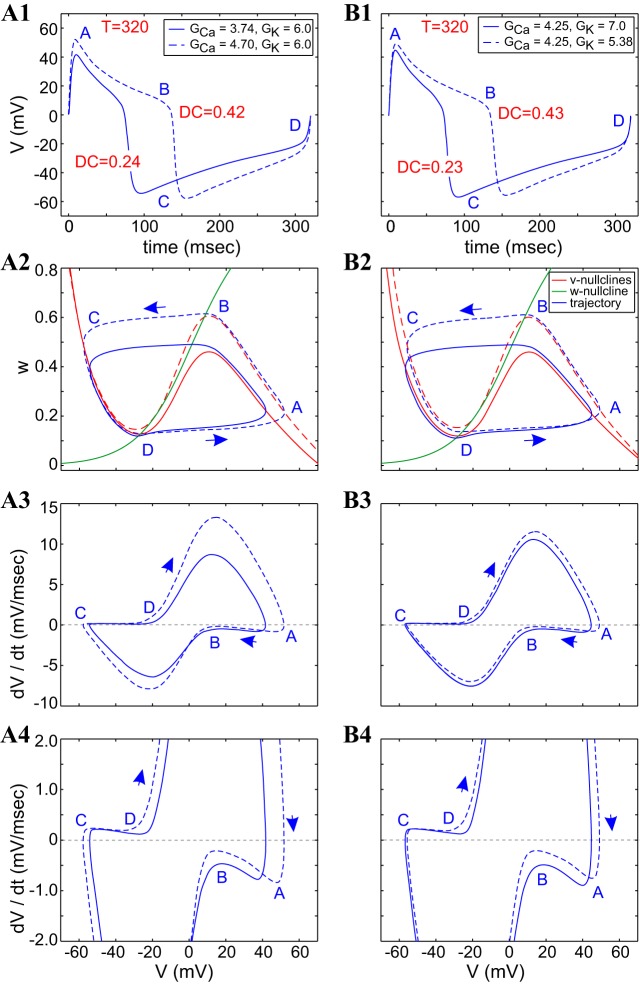
Fig. 9.
ML-Hopf model: oscillatory dynamics along period level set with the same value of either GK or GCa. A1–A4 and B1–B4 correspond to the cases marked with black dots on the period level set curves in Fig. 7A and joined by a dashed horizontal (A) and dashed vertical (B) lines, respectively. A1 and B1: superimposed voltage traces. A2 and B2: superimposed phase-plane diagrams. A3 and A4 and B3 and B4: superimposed v-speed graphs. Parameter values are the following: Iapp = 80 μA/cm2, ϕ = 0.01. GCa and GK are in millisiemens/square centimeter.

