
Fig. A5.
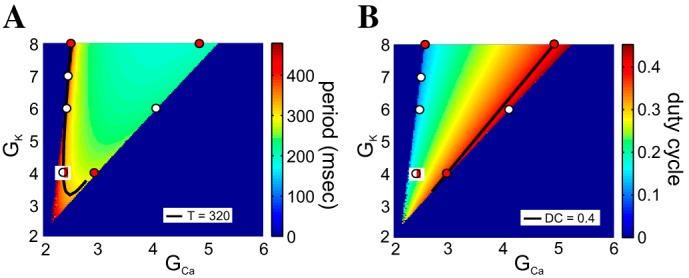
Period and duty-cycle level sets in the GCa–GK parameter space for the ML-SNIC model. A: period heat graphs. B: duty-cycle heat graphs. The colored bars code for the values of the corresponding attribute. The solid black curves indicate the period level set for T = 320 ms (A) and the duty-cycle level set for DC = 0.4 (B). White and red dots highlight points along the 2 level sets in A and B that are analyzed (see Figs. A6 and A7). Iapp = 52 μA/cm2 and ϕ = 0.01. GCa and GK are in millisiemens/square centimeter.