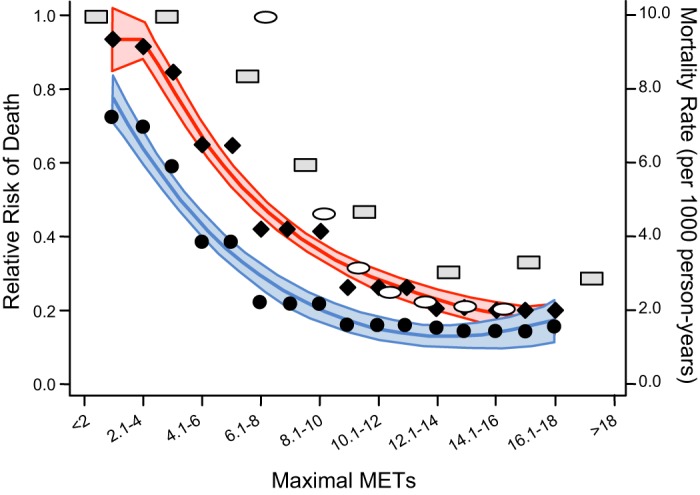
FIGURE 8.

Relative risk of death for all MET values (x-axis) for 10 and greater are all similar during maximal aerobic-type exercise. When METs fall from ~10 to 4 with aging, risk of death increases 4-fold. Three studies are shown, with each from a different decade. Study 1: Blair et al.’s 1989 study (44) of relative risk of death (left y-axis) includes both male and female data from original Figure 4 in JAMA (shown within ovals). Study 2: Kokkinos’ 2008 study in Circulation (256) is relative risk of death in males (shown in rectangles). Study 3: Al-Mallah et al.’s 2016 publication in Mayo Clinic Proceedings (4) shows mortality rate (right y-axis) females (blue line and black circles) and males (red line and black diamonds) with the outer lines showing the 95% confidence intervals.
