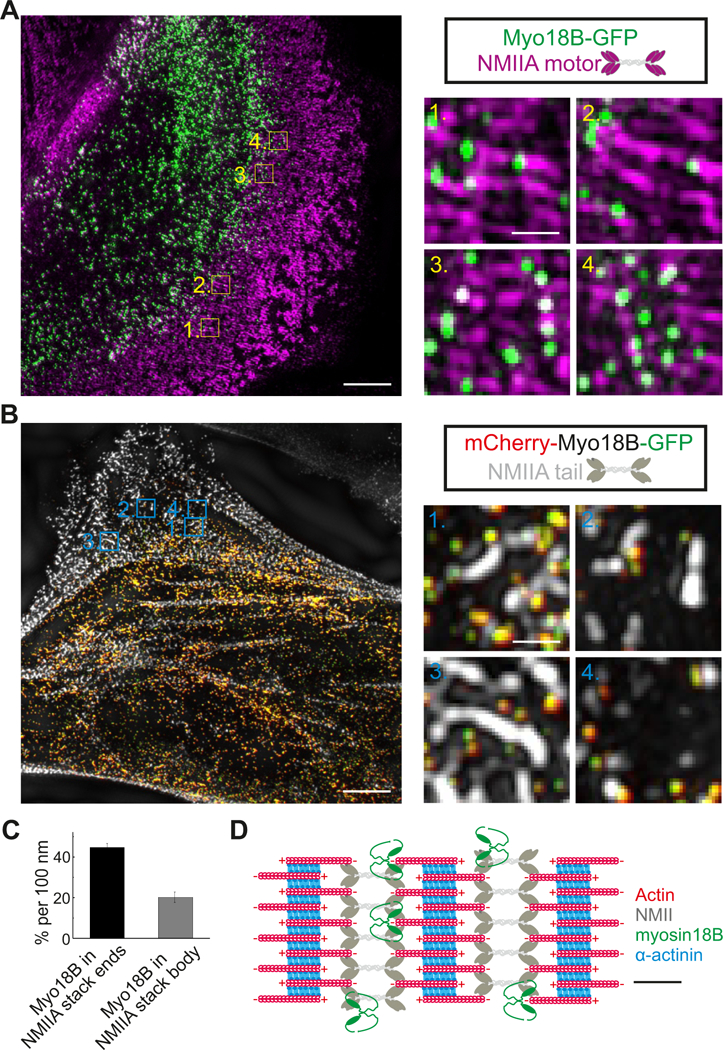
Figure 2. Myosin-18B forms a compact structure, which co-localizes with the myosin II motor domains typically at the distal regions of myosin bundles and stacks.

(A) Representative example of a 3D-SIM image obtained from an U2OS cell transfected with a construct expressing myosin-18B- GFP. Myosin II motor domains (magenta) were visualized by an antibody against the regulatory light chain (RLC). Magnified images illustrate that myosin-18B co-localizes with myosin II motor domains at the ends of large myosin stacks (1, 2) and along the short myosin stacks (3, 4). Bars, 5 µm and 0.5 µm in the left and right magnified panels, respectively. (B) Representative example of a 3D-SIM image obtained from a U2OS cell transfected with a construct expressing myosin-18B fused to mCherry and GFP at its N- and C-termini, respectively. Please note that the N- and C-termini of myosin-18B molecules are close (< 0.1 µm) to each other. The NMIIA tail domain (white) was visualized by an antibody against NMIIA C-terminus. Magnified images illustrate localization of myosin-18B molecules adjacent to the NMIIA tails at the ends of myosin stacks (1, 2), in the region flanking the NMIIA tails in the stack (3), and adjacent to NMIIA tails in small myosin structures (4). Bars, 5 µm and 0.5 µm in the left images of cells and right magnified panels, respectively. (C) The percentage of myosin-18B positive segments at the ends and in the central regions of myosin II stacks (i.e. ~45 % of the 100 nm segments at the ends of NMII stacks contained a myosin-18B puncta, whereas myosin-18B occupancy was ~20 % per 100 nm in the central regions of NMII stacks). Please, see ‘Methods’ for details concerning the quantification. n = 8 cells, and data are presented as mean ± s.e.m. (D) Schematic diagram of myosin-18B localization in actomyosin bundles based on the SIM data. Schematic scale bar, 200 nm. See also Figure S2.
