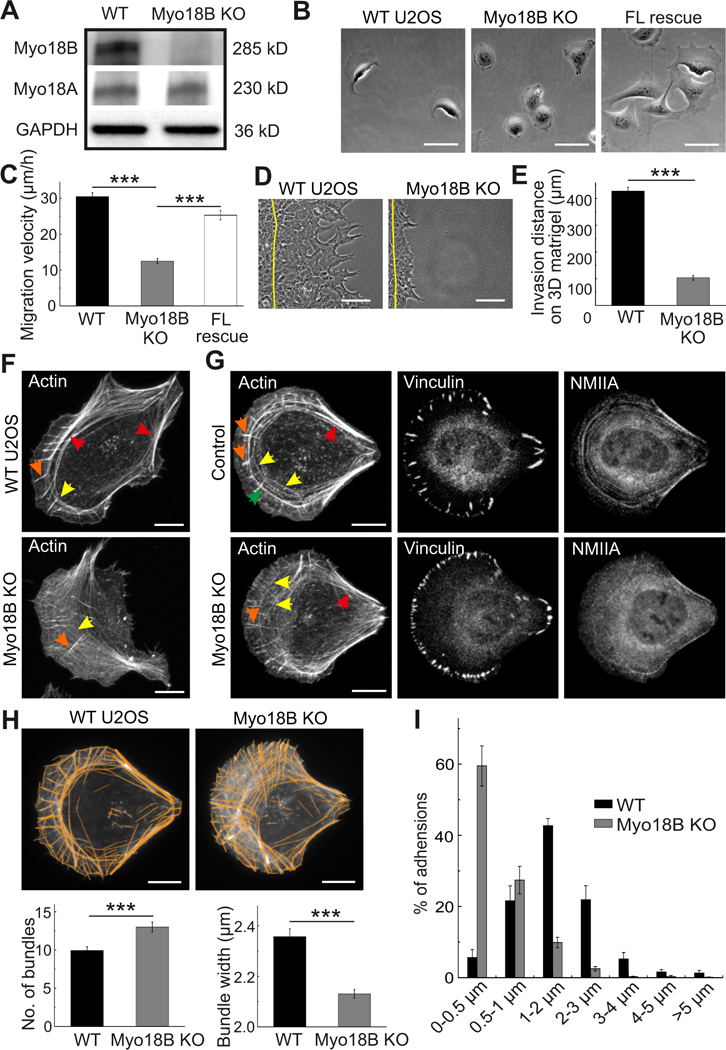
Figure 3. Myosin-18B knockout cells display defects in migration and stress fiber maturation.

(A) Western blot analysis of endogenous myosin-18B and myosin-18A levels in total cell lysates of wild- type U2OS (WT) and myosin-18B CRISPR/Cas9 knockout (KO) cells. GAPDH was probed for equal sample loading. (B) Representative images from time-lapse videos of wild-type, myosin-18B knockout, and full-length myosin-18B rescue (FL rescue) knockout cells migrating on a fibronectin-coated surface. Bars, 50 µm. (C) Random migration velocities of wild-type, myosin-18B knockout, and full- length myosin-18B rescue knockout cells. Quantification is based on tracking of the displacement of nuclei. The data are presented as average velocity obtained from a 12 hour cell tracking ± s.e.m, ***P = <0.001 (t-test). n= 44 for wild-type, 42 for myosin-18B knockout, and 36 for FL rescue cells. (D) Representative images of wild-type and myosin-18B knockout U2OS cells migrated for 48 hours in a 3D Matrigel matrix. Yellow lines indicate the positions of cells at the beginning of experiment. Bars, 30 µm. (E) Invasion distances of wild-type and myosin-18B knockout cells in 3D Matrigel matrix. Quantification is based on 3 independent experiments. The data are presented as averaged invasion distance after incubation of 48 hours ± s.e.m, ***P=<0.001 (t-test). (F) Representative images of actin filaments visualized by phalloidin in wild-type and myosin-18B knockout cells. Bars, 10 µm. (G) Representative images of actin filaments, focal adhesions and myosin IIA visualized by phalloidin, vinculin and NMIIA antibodies staining, respectively, in wild-type and myosin-18B knockout cells cultured on crossbow shaped fibronectin micro-patterns. Bars, 10 µm. Examples of dorsal stress fibers, thin transverse arcs, thick arcs, and ventral stress fibers in panels F and G are indicated by orange, yellow, green, and red arrows, respectively. (H) Representative examples of cells, and quantification of numbers of actin filament bundles and their widths by software FilamentSensor_0.2.2. Bars, 10 µm. (I) The length distributions of vinculin-positive focal adhesions (FAs). The numbers of adhesions in each size group were divided with the total focal adhesion number of the same cell. n = 774 FAs from 11 cells (wild-type) and 1575 FAs from 10 cells (myosin-18B knockout). Data are presented as mean ± See also Figure S3.
