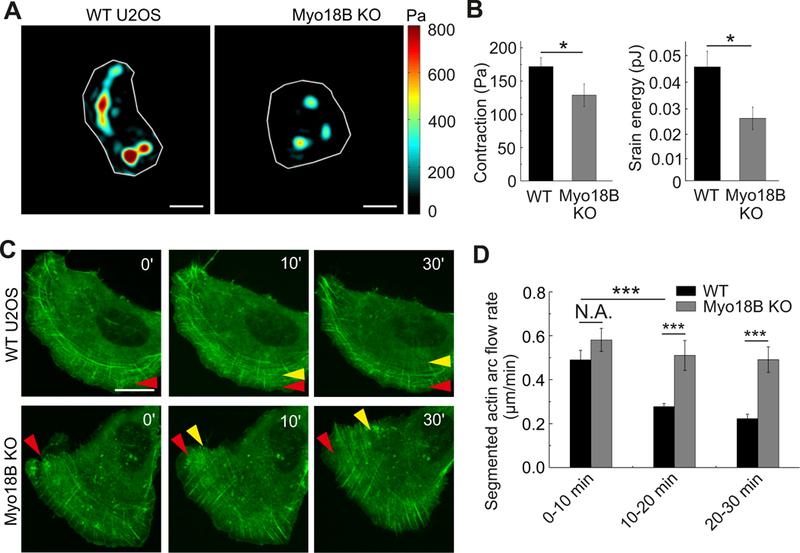
Figure 4. Myosin-18B knockout cells display increased centripetal flow of transverse arcs, and reduced contractility.

(A) Representative force maps of wild-type and myosin-18B knockout U2OS cells grown on 25 kPa polyacrylamide dishes with fluorescent nanobeads. Bars, 10 µm. (B) Quantification of contraction (root mean square traction) in wild-type (n=68) and myosin-18B knockout cells (n=32) from three independent experiments. The data are presented as mean ± s.e.m. *P=0.033 (non-parametric analysis). (C) Representative examples of transverse arc flow visualized in wild-type and myosin-18B knockout U2OS cells expressing GFP-actin. Red arrows indicate the positions of the observed arcs in the beginning of the movies, and yellow arrows indicate the positions of the same arcs in subsequent time-lapse images. Bars, 20 µm. (D) The time-segmented centripetal flow rates of transverse arcs in wild-type (n=10) and myosin-18B knockout (n=11) cells. Data are represented as mean ± s.e.m. ***P=<0.001 (t-test). See also Figures S4 and S5, and videos S1 and S2.
