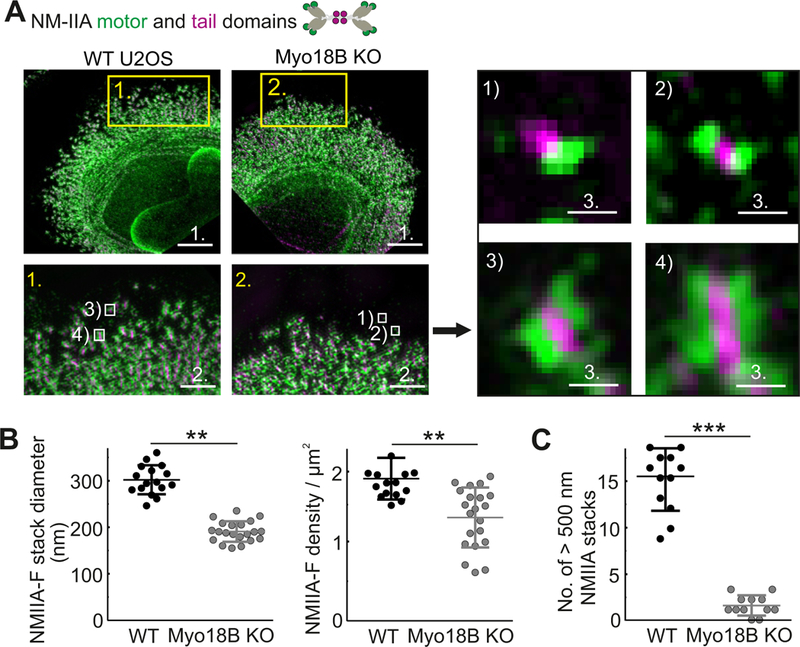
Figure 5. Myosin-18B knockout cells display defects in formation of large NMII stacks.

(A) 3D- SIM images of representative wild-type and myosin-18B knockout cells where NMIIA motor and tail domains were visualized by antibodies against regulatory light chain (RLC) and NMIIA C-terminus, respectively. Bars, 5 µm. Magnified images (corresponding to the yellow boxes) display characteristic NMIIA filament distributions in wild-type and myosin-18B knockout cells. Bars, 1 µm. White boxes in magnified regions display examples of: 1) unipolar NMII structures, 2) bipolar NMII filaments, 3) small (lateral diameter < 500 nm) NMII stacks, and 4) large (lateral diameter > 500 nm) NMII stacks, which are displayed on the right. Bars, 200 nm. Bars; 1 (5 µm); 2 (1 µm); 3 (200 nm). (B) The average diameters (nm) and densities (number/µm2) of NMIIA stacks were manually measured. n = 16 cells for wild-type and 21 cells for myosin-18B knockout. Data are represented as mean ± s.e.m. **P=<0.01, ***P=<0.001 (t-test). (C) The numbers of large (lateral diameter >500 nm) NMIIA stacks in the 900 µm2 area within 20 µm wide regions from the edge of cells. n = 12 cells for wild-type and 12 cells for myosin-18B knockout. Data are represented as mean ± s.e.m. ***P=<0.001 (Mann-Whitney u-test). See also Figure S5.
