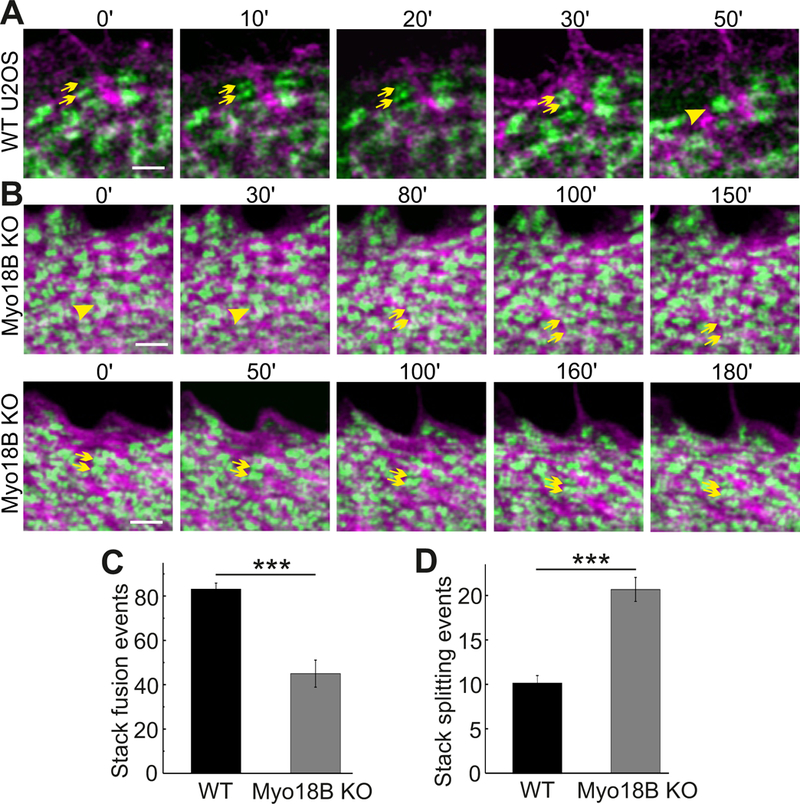
Figure 6. Myosin-18B knockout cells exhibit decreased stability of NMII stacks.

(A and B) Representative time-lapse images recorded with Zeiss Airyscan microscope. Wild-type and myosin- 18B knockout U2OS cells were transfected with plasmids expressing GFP-NMIIA and actin-RFP. An example of NMIIA filament concatenation event is indicated in panel (A) (two NMIIA filaments indicated by yellow arrows fuse with each other to form a NMIIA stack indicated by a yellow arrowhead). An example of NMIIA stack fission event is highlighted in panel (B) upper row (myosin stack indicated by a yellow arrowhead splits into two NMIIA filaments indicated by yellow arrows), and an example of fusion failure of two small NMIIA stacks is highlighted in panel (B) lower row (myosin stacks indicated by yellow arrows). Bars, 1 µm. (C and D) The number of NMIIA filament fusion and splitting events quantified from 900 µm2 areas within 20 µm wide regions from the cell edge in 10 min movies. n = 14 cells for wild-type and 14 cells for myosin-18B knockout. Data are represented as mean ± s.e.m. ***P=<0.001 (Mann-Whitney u-test). See also Figure S6, and videos S3, S4 and S5.
